


Embedded systems, such as smart thermostats, rely heavily on event-driven logic to function correctly. Modeling these behaviors before implementation is crucial for avoiding errors and ensuring system reliability. One of the most powerful tools for this purpose is the UML State Machine Diagram. In this tutorial, we will explore how to model a smart thermostat using UML, interpreting its states and transitions, and demonstrating how modern tools like Visual Paradigm can accelerate the design process through AI.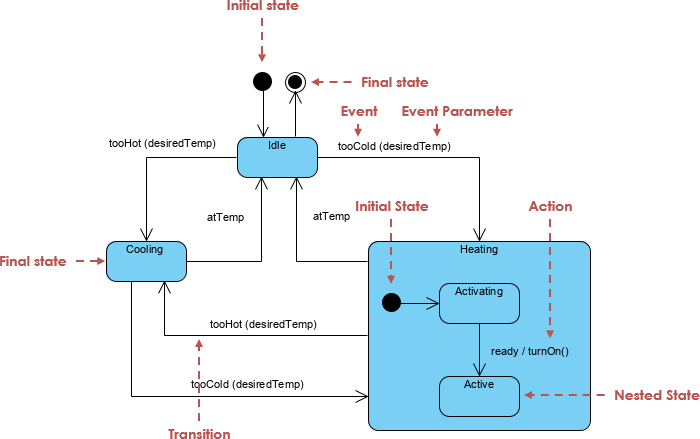
System Overview: Understanding Smart Thermostat Behavior
Before diving into the diagram, it is essential to understand the logic governing the system. A smart thermostat monitors the current room temperature and compares it against a user-defined desired temperature. The system maintains equilibrium by activating heating or cooling mechanisms based on specific thresholds.
Key characteristics of this system include:
- Event-Driven Architecture: The system reacts to changes in temperature or user inputs.
- Guarded Transitions: Decisions are based on conditions, such as
tooHot(desiredTemp)ortooCold(desiredTemp). - Composite States: Complex modes, like heating, often require internal steps (e.g., warming up before becoming active).
Step-by-Step Interpretation of the State Machine
To effectively model this system, we break it down into distinct states and transitions. Below is a detailed analysis of the thermostat’s lifecycle.
1. The Initial and Idle States
The system begins at the Initial State (represented by a black filled circle), which immediately transitions to the Idle State. In this top-level state, the system is passive, waiting for the room temperature to deviate from the desired setting.
From the Idle state, two primary transitions can occur:
- If the temperature rises above the threshold, the event
tooHot(desiredTemp)triggers a transition to the Cooling state. - If the temperature drops below the threshold, the event
tooCold(desiredTemp)triggers a transition to the Heating state.
2. The Cooling State
The Cooling State represents the active air conditioning mode. It is a simple state where the cooling mechanism runs until the room reaches the target temperature. Once the condition atTemp is met, the system transitions back to Idle.
Although rare, a direct transition from Cooling to Heating is possible if the temperature drops drastically, triggering tooCold(desiredTemp). This safeguards against rapid environmental changes.
3. The Heating State (Composite State)
The Heating State is more complex and is modeled as a Composite State containing nested regions. This structure is necessary because heating systems often require a startup sequence.
- Activating (Sub-state): Upon entering the Heating state, the system starts in the ‘Activating’ sub-state. This represents the heater warming up or a pre-ignition phase.
- Active (Sub-state): Once the heater is ready, the event
readytriggers the actionturnOn(), moving the system to the ‘Active’ sub-state where full heating occurs.
The system exits the Heating composite state and returns to Idle when the atTemp condition is satisfied.
Guidelines for Creating Effective UML State Diagrams
When modeling your own stateful systems, follow these structured steps to ensure clarity and accuracy:
- Define the Scope: Clearly identify the object being modeled (e.g., “Thermostat Controller”).
- Identify Main States: List the stable conditions the system can be in, such as Idle, Heating, or Cooling.
- Determine Triggers: specific events that cause state changes, such as sensor readings or timeouts.
- Specify Guards and Actions: Define the logic (
[tooHot]) required for a transition and the resulting actions (/turnOn()). - Use Composite States: Group related sub-states to handle complexity without cluttering the main diagram.
- Validate Completeness: Ensure every state has an entry and exit path (excluding final states) and check for unreachable states.
Tips and Tricks for Better Modeling
To elevate the quality of your diagrams, apply the following best practices:
| Tip | Explanation | Benefit |
|---|---|---|
| Use Self-Transitions | Use for internal events like periodicCheck / logTemp(). |
Keeps the diagram clean by avoiding external loops for internal logic. |
| Prefer Entry/Exit Actions | Place actions like turnOnHeater() inside the state rather than on the transition. |
Reduces redundancy if multiple transitions lead to the same state. |
| Model Hysteresis | Define separate thresholds for tooHot and tooCold. |
Prevents the system from rapidly flickering on and off around the target temperature. |
| Use History States | Implement shallow or deep history pseudostates. | Allows the system to resume its previous sub-state after an interruption (e.g., power loss). |
Accelerating Design with Visual Paradigm AI
Creating complex state diagrams manually can be time-consuming. Modern tools like Visual Paradigm now offer AI-powered features to automate the generation and refinement of these models.
How to Use AI for State Diagrams
Follow this workflow to generate a thermostat model in minutes: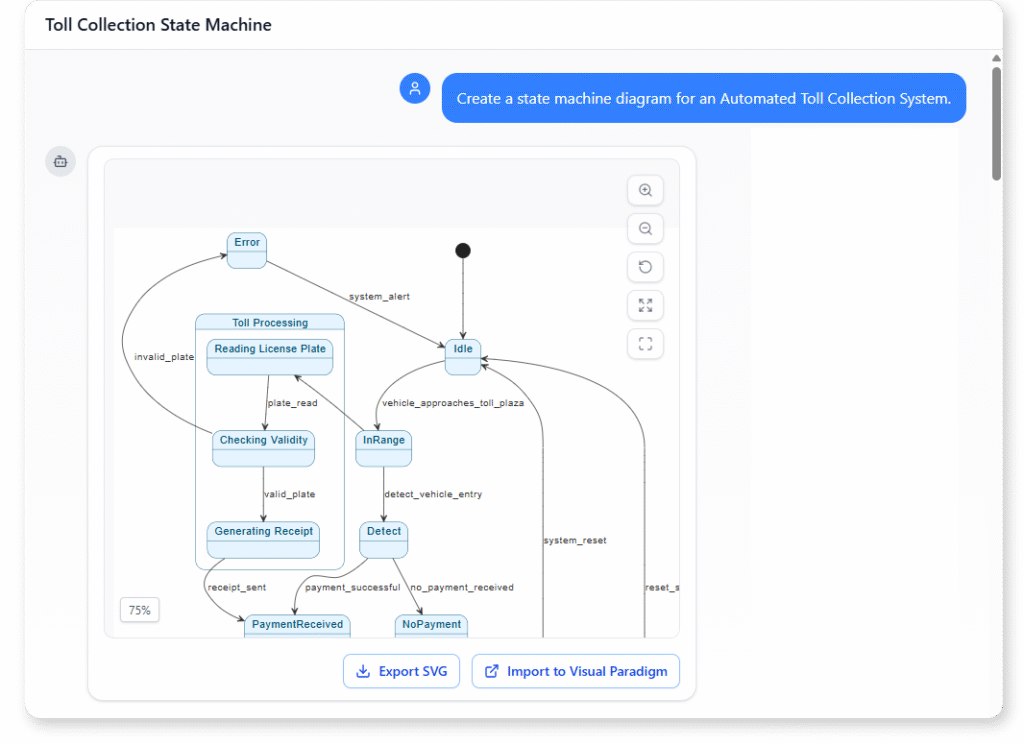
- Launch Visual Paradigm: Open the AI Chatbot or the AI Diagram Generator panel.
- Input a Natural Language Prompt: Describe the system logic clearly. for example:
“Create a UML State Machine Diagram for a smart thermostat. It starts in Idle. If too hot, go to Cooling. If too cold, go to Heating. Heating is a composite state with Activating and Active sub-states. Return to Idle when the desired temperature is reached.” - Generate and Refine: The AI will produce the initial diagram. You can then refine it conversationally by typing commands like “Add an entry action to Cooling: startFan()” or “Make Heating use a history state.”
- Validate and Export: Ask the AI to check for unreachable states, and once satisfied, generate the Python or C++ code directly from the model.
By leveraging these AI tools, developers can reduce initial drawing time by up to 80%, allowing for more focus on system logic and less on the mechanics of diagramming.
Visual Paradigm State Diagram Resource
The following articles and resources provide detailed information on using AI-powered tools to create, refine, and master UML state machine diagrams within the Visual Paradigm platform:
-
Mastering State Diagrams with Visual Paradigm AI: A Guide for Automated Toll Systems: This guide demonstrates how to utilize AI-enhanced state diagrams to model and automate the complex behaviors of an automated toll system.
-
AI-Powered UML Chatbot State Diagrams: This article explores the ways artificial intelligence improves the creation and interpretation of UML state diagrams specifically for the development of chatbot systems.
-
Definitive Guide to UML State Machine Diagrams with AI: This comprehensive resource provides a detailed guide on using AI-enhanced modeling tools to visualize object behavior through UML state machine diagrams.
-
Interactive State Machine Diagram Tool: This web-based platform allows teams to create and edit state machine diagrams in real time with generative AI support for faster software engineering workflows.
-
Visual Paradigm – UML State Machine Diagram Tool: This interactive online tool provides a dedicated interface for creating, editing, and exporting detailed UML state machine diagrams for modern software design.
-
AI Chatbot for Diagram and Model Generation: This AI-powered assistant enables users to generate various models, including state diagrams, through natural language interaction and simple text prompts.