A Third-Party Expert’s Perspective on Mastering Hierarchical Visualization
Author Note: This guide is written from the perspective of an experienced product documentation specialist who has tested the OpenDocs Tree Diagram Editor extensively. All information is based on official Visual Paradigm release materials combined with practical implementation insights.
🌟 Introduction

On February 2, 2026, Visual Paradigm announced a significant expansion to OpenDocs, introducing eight new specialized chart types. Among these, the Tree Diagram Editor stands out as a game-changer for professionals who need to visualize hierarchical data with clarity and speed.
Whether you’re mapping complex file systems, documenting organizational structures, or designing logical decision paths, this new component transforms abstract hierarchies into professional, interactive visuals—in seconds.
🔑 Key Concepts
What Is a Tree Diagram?
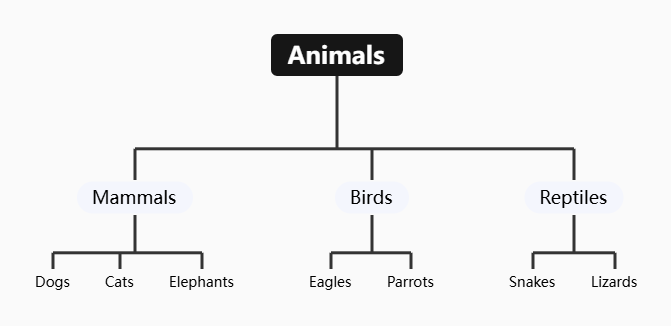
A Tree Diagram is a specialized visualization format designed to represent hierarchical data starting from a single root node that branches into multiple child relationships. Unlike free-form mind maps, Tree Diagrams emphasize:
| Feature | Benefit |
|---|---|
| Structured Layout | Top-down or left-to-right orientation for logical flow |
| Single Root Origin | Clear starting point for hierarchical relationships |
| Parent-Child Relationships | Explicit visual connections between levels |
| Scalable Branching | Accommodates simple to deeply nested structures |
Tree Diagram vs. Mind Map: When to Use Which?
✅ Use Tree Diagrams when:
• Documenting technical architectures or site maps
• Creating classification systems or taxonomies
• Visualizing decision trees with clear branching logic
• Presenting organizational charts with reporting lines

✅ Use Mind Maps when:
• Brainstorming ideas with non-linear connections
• Exploring concepts with cross-references between branches
• Creating personal knowledge maps with flexible structure
Two Integration Modes in OpenDocs
-
Embedded Components: Drop diagrams directly into Markdown documentation for contextual visual support
-
Dedicated Component Pages: Create standalone diagram pages for high-level architectural overviews or reference libraries
🚀 Getting Started: Step-by-Step Workflows
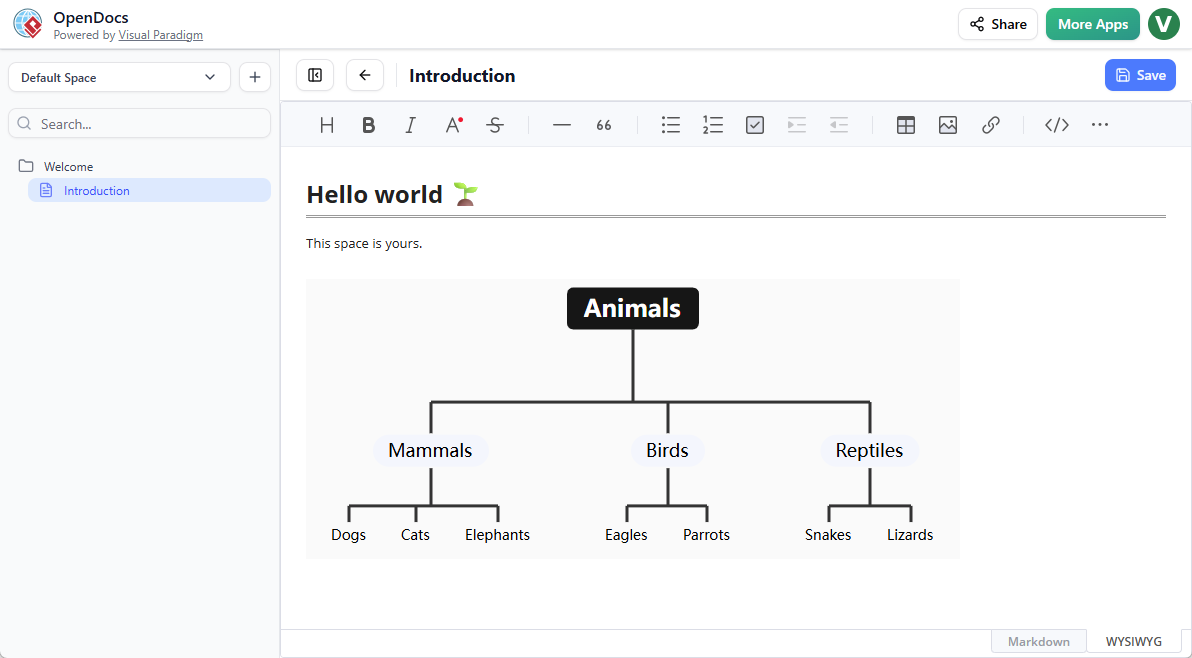
Method 1: Creating a Tree Diagram Within a Document Page
Follow this workflow to embed hierarchical visuals directly into your content:
-
Open your page in OpenDocs
-
Click the Edit button at the top right
-
Position your cursor where you want the diagram to appear
-
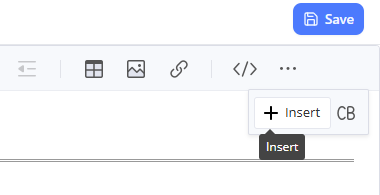
Click the Insert button in the editor toolbar
-
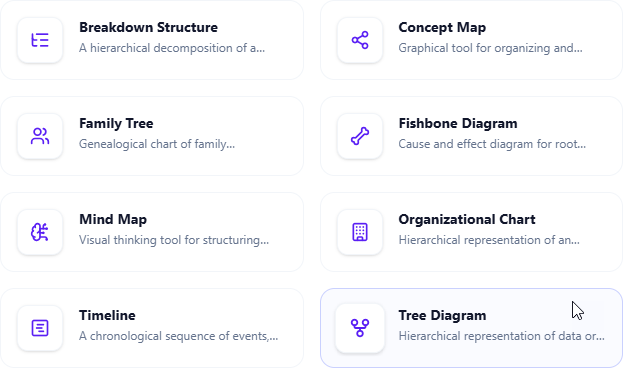
Navigate to Mind Maps > Tree Diagram
-
Begin editing your tree structure using the intuitive node editor
-
Click Save at the top right when finished
-
Click Close to return to your document with the embedded diagram live
Method 2: Creating a Standalone Tree Diagram Component Page
Ideal for architectural overviews or reference diagrams used across multiple documents:
-
In the table of contents pane, click + → New Component Page
-
Select Mind Maps > Tree Diagram
-
Build your hierarchical visualization using the full editor canvas
-
Click Save at the top right
-
Link to this component page from any document using
[[Component Page Name]]syntax
💡 Expert Guidelines: Best Practices from Real-World Usage
✅ Do This
-
Start with a clear root node: Name your root descriptively (e.g., “Product Architecture” vs. just “Root”)
-
Limit branching depth: Aim for 3-5 levels maximum for readability; use linked component pages for deeper hierarchies
-
Use consistent naming conventions: Apply parallel structure to sibling nodes (all verbs, all nouns, etc.)
-
Leverage color coding: Assign colors to branch categories (e.g., blue for technical components, green for user-facing features)
-
Add tooltips or notes: Use node descriptions to provide context without cluttering the visual
❌ Avoid This
-
Overloading single nodes: Keep node labels concise (under 8 words); move details to descriptions
-
Creating “spaghetti trees”: If branches cross excessively, reconsider your hierarchy or split into multiple diagrams
-
Ignoring mobile responsiveness: Test embedded diagrams on different screen sizes; complex trees may need dedicated pages
-
Forgetting version context: Add a “Last Updated” note to component pages used in living documentation
🔧 Pro Workflow Tips
1. Draft your hierarchy in bullet-point Markdown first:
-
Root
-
Branch A
-
Leaf A.1
-
Leaf A.2
-
-
Branch B
-
2. Paste into the Tree Diagram editor for instant visual conversion
3. Use keyboard shortcuts: `Tab` to create child nodes, `Enter` for siblings
4. Export diagrams as PNG/SVG for presentations using the toolbar export option
5. Link related component pages using OpenDocs' internal linking for navigable knowledge networks
🎯 Common Use Cases & Implementation Examples
| Use Case | Implementation Strategy | Pro Tip |
|---|---|---|
| Software Architecture Docs | Map microservices, dependencies, and data flow | Use color-coded branches for service types (API, DB, UI) |
| Organizational Charts | Visualize reporting structures with role descriptions | Add hyperlinks on nodes to team member profiles |
| Decision Trees | Document approval workflows or troubleshooting paths | Use conditional formatting to highlight decision outcomes |
| Content Taxonomies | Structure knowledge base categories and tagging systems | Keep taxonomy depth shallow; use cross-references for related topics |
| Project Work Breakdown Structures | Break epics into tasks with ownership assignments | Integrate with OpenDocs task tracking for live status updates |
🔗 Integration with the OpenDocs Ecosystem
The Tree Diagram doesn’t exist in isolation. Its true power emerges when combined with other OpenDocs capabilities:
-
🔄 Mind Maps: Start with free-form brainstorming, then convert selected branches to structured Tree Diagrams
-
🐟 Fishbone Diagrams: Use Tree Diagrams for solution hierarchies after root-cause analysis with Fishbone
-
📅 Timelines: Pair hierarchical task breakdowns (Tree) with execution schedules (Timeline)
-
👨👩👧👦 Family Trees: Adapt the same editor logic for genealogy or product lineage documentation
💡 Expert Insight: Create a “Diagram Library” component page that catalogs all your Tree Diagrams with brief descriptions and use-case tags. Link to this library from your team’s onboarding documentation to accelerate adoption.
🛠️ Troubleshooting Common Challenges
| Issue | Solution |
|---|---|
| Diagram won’t embed properly | Ensure you’re in Edit mode; refresh the page if the insert menu doesn’t appear |
| Nodes overlap or become unreadable | Use the “Auto-layout” feature in the diagram toolbar; reduce font size for deep hierarchies |
| Changes aren’t saving | Click Save before closing the editor; check your internet connection for cloud sync |
| Need to collaborate in real-time | Share the component page link with edit permissions; use OpenDocs comments for feedback |
| Exporting for presentations | Use the toolbar’s export function; choose SVG for scalable vector graphics in slide decks |
📚 Reference List
-
OpenDocs Landing Page: Learn more about the vision for a unified AI-powered knowledge management tool
-
Try the Tree Diagram Editor: Jump directly into the application to try the tree diagram tool
-
Mind Maps Integration: Details about Mind Maps support in OpenDocs
-
Fishbone Diagrams for Root Cause Analysis: Information about Fishbone Diagram functionality
-
Timeline Diagram Updates: Details about Timeline diagram features
-
Family Tree Diagram Tool: Information about Family Tree diagram capabilities
Final Thought from an Experienced User:
“The Tree Diagram Editor in OpenDocs isn’t just another charting tool—it’s a thinking partner. By forcing you to articulate relationships explicitly, it reveals gaps in your logic and opportunities for simplification. Start small: convert one bulleted list in your next document into a tree. You’ll quickly discover why hierarchical clarity is worth the extra minute of setup.”
— Alex Johnson, Senior Product Manager & Documentation Advocate