Ever felt stuck staring at a blank canvas during a critical Root Cause Analysis (RCA) session? We’ve all been there! Identifying why complex problems like high employee turnover occur is challenging enough without the added stress of manual diagram formatting. That is exactly where the AI Fishbone Diagram generator in Visual Paradigm Desktop steps in to save the day. This revolutionary tool transforms your raw thoughts and brainstorming notes into a structured, professional Ishikawa diagram in seconds. By simply describing your problem, you can bypass the tedious drawing phase and jump straight into solving the actual issues affecting your organization’s performance and culture!
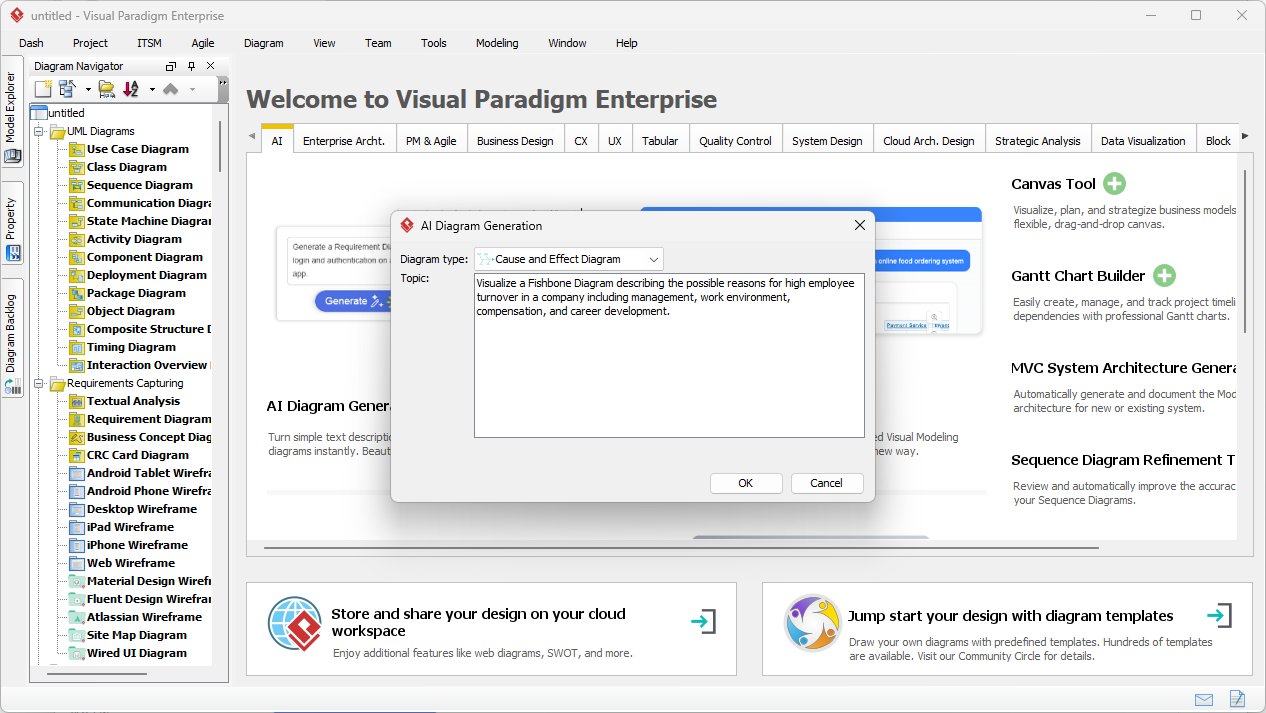
In the initial stage of this streamlined workflow, the user interacts with a clean, intuitive AI Diagram Generation interface. As shown in the software workspace, you simply select “Cause and Effect Diagram” from the dropdown menu and input a natural language description. In this specific scenario, the user is tackling the multi-faceted issue of high employee turnover, prompting the AI to consider categories such as management, work environment, compensation, and career development. This professional Fishbone Diagram software takes your text and intelligently infers the hierarchy of the problem.
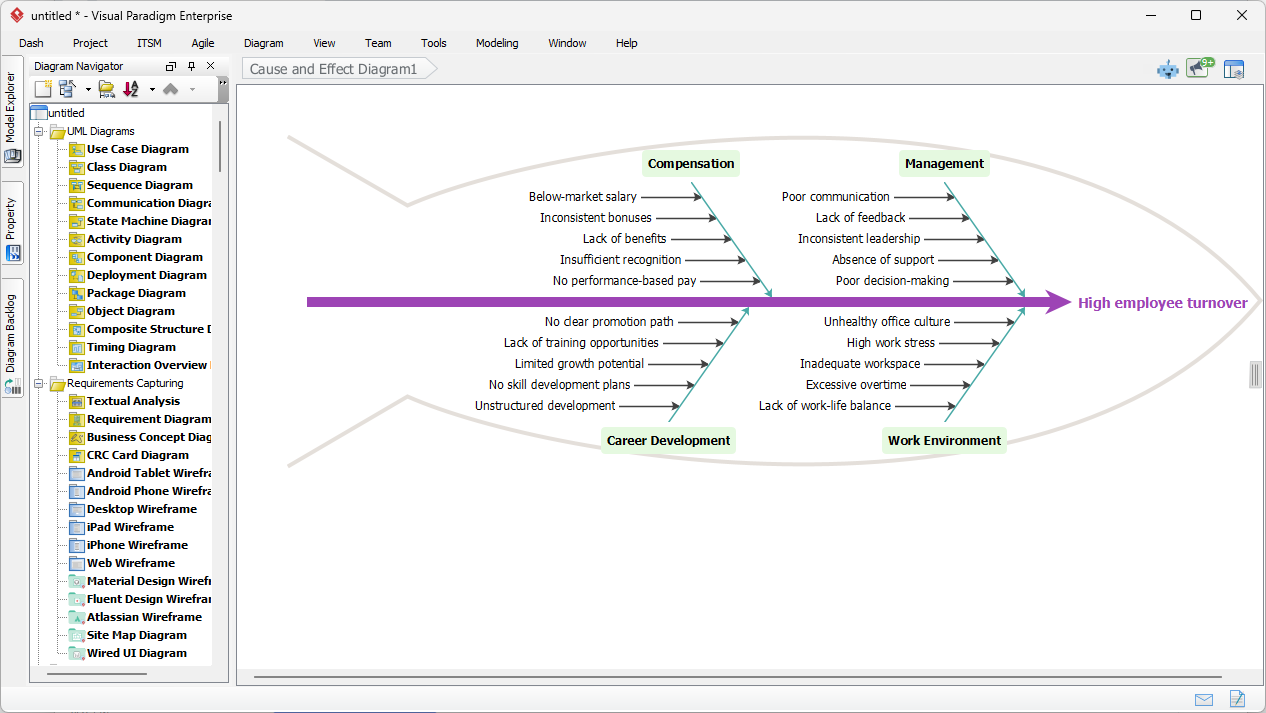
Once the AI processes your prompt, it produces a stunningly detailed and logically organized visualization. The “head” of the fish clearly identifies the primary effect—High employee turnover—while the major “bones” extend into the specific categories you requested. Notice how the easy-to-use AI Fishbone Diagram tool automatically populates sub-branches with highly relevant factors such as “below-market salary” under Compensation or “poor communication” under Management. This level of automated detail provides an immediate, high-quality foundation for team discussions, kaizen events, or executive reporting.
Why Use an AI-Powered Root Cause Analysis Tool?
Traditional brainstorming often results in a messy pile of sticky notes or a disorganized list of complaints. Turning those notes into a coherent Ishikawa diagram manually can take hours of clicking and dragging. Visual Paradigm’s AI Fishbone Diagram generator eliminates this friction entirely! Whether you are a Six Sigma Black Belt or a first-time project manager, the ability to generate a structured analysis from a simple paragraph is a total game-changer for organizational efficiency.
Quick Summary: Key Takeaways
-
Instant Structure: Convert natural language descriptions into a classic fish-shaped hierarchy in seconds.
-
Expert Categorization: Automatically detects and organizes causes into standard 6M or custom categories.
-
Full Editability: The AI provides the starting point, but you maintain 100% control to refine, color-code, and annotate.
-
Versatile Applications: Perfect for HR analysis, manufacturing quality control, and service delivery troubleshooting.
-
Seamless Integration: Part of the robust Visual Paradigm ecosystem, allowing you to link your RCA to action plans and process maps.
Feature Deep Dive: What Makes it the Best AI Fishbone Diagram Maker?
The power of this feature lies in its Natural Language Understanding. The AI doesn’t just copy your words; it interprets the relationship between them. If you mention “outdated GPS” and “aging delivery vehicles,” it knows these belong under “Equipment.” This level of Smart Category Detection ensures that your diagrams follow industry standards like the 6Ms (Man, Machine, Method, Material, Measurement, Mother Nature) without you having to manually sort every point.
Furthermore, the Hierarchical Branching logic ensures that secondary and tertiary causes are placed at optimal angles for maximum readability. No more overlapping lines or cramped text! Because it is fully integrated into Visual Paradigm Desktop, you can instantly transition from a generated diagram to a deep-dive analysis. You can change colors to highlight high-priority root causes, add evidence notes to specific branches, or even link a cause directly to a corrective action plan diagram within the same project file.
Who Should Use This Tool?
This feature is a powerhouse for anyone dedicated to continuous improvement. It is particularly valuable for:
-
Quality Assurance Professionals: Speed up the documentation of defects and process deviations.
-
HR and Operations Managers: Visualize complex social and systemic issues like turnover or low morale.
-
Lean and Six Sigma Practitioners: Use it as a rapid starting point for 5-Why analysis and Kaizen sessions.
-
Project Managers: Quickly diagnose the “why” behind project delays or budget overruns.
How to Get Started with AI Diagramming
Ready to supercharge your problem-solving sessions? Getting started is incredibly simple! Follow these steps to generate your first professional analysis:
-
Launch Visual Paradigm Desktop and open your project.
-
Navigate to the Tools menu and select AI Diagram Generation.
-
Choose Cause and Effect Diagram as your diagram type.
-
Enter your problem statement and any suspected causes in the prompt box. For example: “Problem: Decreasing software quality. Causes: Lack of automated testing, high developer burnout, unclear requirements, and outdated development tools.”
-
Click OK and watch as the AI Fishbone Diagram generator constructs your visual analysis instantly!
Once generated, don’t forget to take advantage of the Classic Fishbone Layout features. You can drag branches to reorder them, use the “Format Painter” to keep your styles consistent, and export your final result as a high-resolution PNG or PDF for your next big stakeholder meeting. It’s never been easier to look like a quality management pro!
Conclusion: Transform Your Analysis Today
Visual Paradigm’s AI Fishbone Diagram generator is more than just a drawing aid; it’s a cognitive partner that helps you organize complexity into clarity. By leveraging the latest in AI technology, it empowers teams to focus on finding solutions rather than fighting with software tools. From analyzing high employee turnover to fixing manufacturing bottlenecks, this professional diagramming software provides the speed and precision needed in today’s fast-paced business environment. Stop wasting time on manual layouts and start uncovering the root causes that matter!
Experience the future of root cause analysis for yourself! Visit the link below to download the latest version of Visual Paradigm and start using the most advanced AI Fishbone Diagram generator on the market today.
Try it now: Download Visual Paradigm Desktop
Related Links
Fishbone diagrams, also known as Ishikawa diagrams, are powerful tools for root cause analysis that visually organize potential factors contributing to a specific problem or defect, often enhanced by AI-driven automation and specialized industry templates.
-
How to Create a Fishbone Diagram: A Step-by-Step Guide: A comprehensive tutorial on using these diagrams to identify root causes within processes, projects, or systems.
-
Free Fishbone Diagram Tool – Create Diagrams Instantly: An online platform for creating professional fishbone diagrams without the need for registration or software installation.
-
Fishbone (Ishikawa) Diagram Template – Ready-to-Use: A customizable starting point for quickly visualizing and analyzing root causes across various business sectors.
-
AI-Powered Fishbone Diagram Generator – Uncover Root Causes in Seconds: This article explores how artificial intelligence can automate the diagram creation process to accelerate root cause analysis.
-
Fishbone Diagram and 5 Whys – Visual Paradigm: A guide on integrating fishbone diagrams with the 5 Whys technique to deepen investigations into quality control and project management issues.
-
Unraveling Complex Issues: The Power of Cause and Effect Analysis: This resource explains how structured Ishikawa diagrams facilitate problem-solving and process improvement in business operations.
-
Fishbone Diagram Template for Inventory Management Issues: A specialized template used to identify the root causes of supply chain delays, overstocking, and inventory discrepancies.
-
Fishbone Diagram Template for Product Defects Analysis: A targeted tool for manufacturing and quality assurance teams to analyze defects and improve product integrity.
-
Cause and Effect Diagram Tool – Visual Paradigm Features: An overview of software functionalities designed for visualizing and analyzing root causes within professional project contexts.
-
Fishbone Analysis: Concepts, Examples, and the Role of AI: A deep dive into the fundamental concepts of Ishikawa diagrams and the advantages of using AI-powered modeling tools.