


In the fast-paced world of software development, bridging the gap between written requirements and technical implementation is a critical challenge. Traditionally, business analysts and developers have spent countless hours manually translating text-based use cases into visual flowcharts. This process is not only tedious but prone to human error.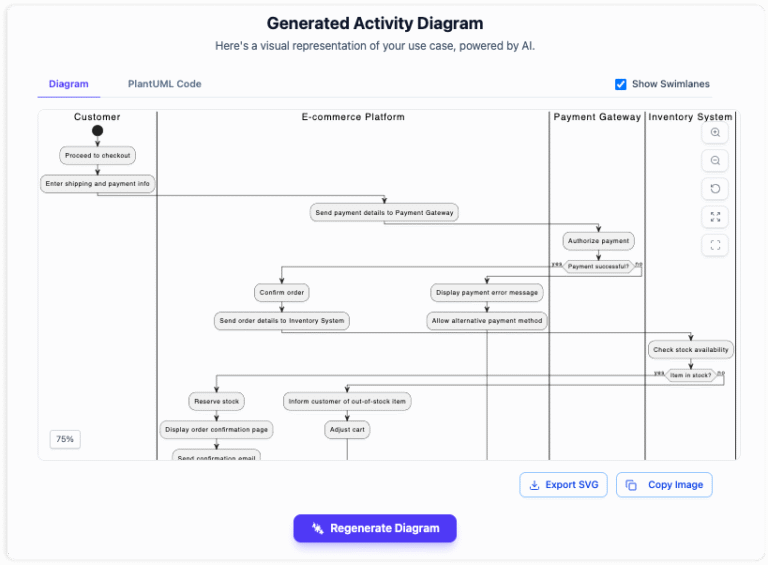
Fortunately, the advent of AI-powered tools has revolutionized this workflow. By automating the generation of UML activity diagrams and comprehensive reports directly from text, teams can significantly improve clarity and reduce development time. This guide explores how to leverage AI to transform your software requirements into professional visuals instantly.
Key Concepts
Before diving into the workflow, it is essential to understand the foundational elements involved in this automation process. These concepts ensure that both technical and non-technical stakeholders share a common language.
- Use Case: A textual description of how a user interacts with a system to achieve a specific goal. It typically includes actors, preconditions, and a sequence of steps.
- UML Activity Diagram: A behavioral diagram that visually portrays the flow of control or object flow. It is essentially a flowchart that represents the logic defined in the use case.
- Mermaid Syntax: A JavaScript-based diagramming and charting tool that renders Markdown-inspired text definitions to create and modify diagrams dynamically. This is often the underlying technology used by AI tools to generate charts code-first.
- Actors: The entities (users or other systems) that interact with the subject system during the use case.
Guidelines: Step-by-Step Tutorial
Transforming a static text document into a dynamic visual diagram does not have to be complex. Follow these four standardized steps to generate perfect diagrams and reports using AI automation.

Step 1: Identify the Scope
The first step in the process is establishing the context. An AI tool requires specific parameters to generate an accurate representation of the system. You must clearly define the metadata of your project.
Start by inputting the Use Case Name to title your diagram. Next, identify the System boundaries to determine what is internal versus external logic. Finally, list all Actors involved. Setting this stage ensures the AI understands who is performing the actions and where the process takes place.
Step 2: Describe the Process Flow
Once the context is set, you need to provide the narrative. This is the core data entry phase where you detail the logic of the software requirement. Instead of writing paragraphs, break the logic down into structured flows.
Detail the Main Flow (the happy path), Alternative Flows (user variations), and Error Conditions (what happens when things go wrong). Use simple, line-by-line steps. The clearer your textual description, the more accurate the resulting diagram will be.
Step 3: Generate the Diagram
With the setup and description complete, the AI takes over the heavy lifting. By clicking the generation command, the tool interprets your structured text and instantly converts it into a standardized UML Activity Diagram.
Behind the scenes, the AI is often constructing the visual using Mermaid syntax or similar code-based logic. This ensures the output is not just an image, but a structured schema that represents the exact flow, decision diamonds, and end states described in your text.
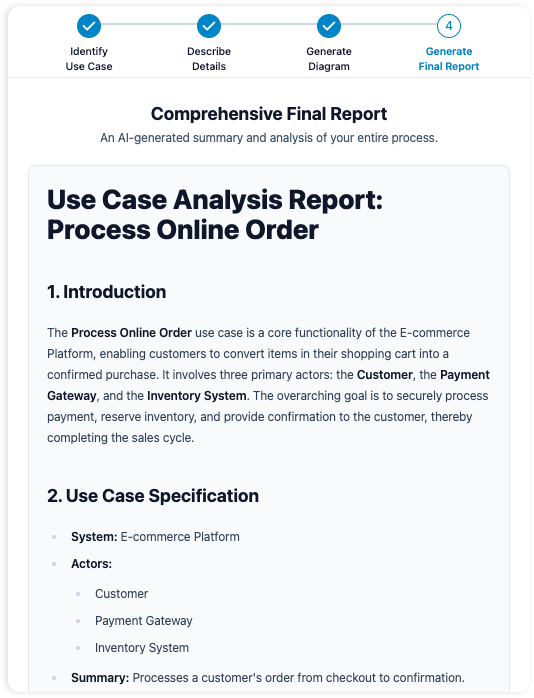
Step 4: Generate the Report
Visuals are powerful, but documentation is necessary for sign-offs and audits. The final step is to generate a comprehensive report. This document summarizes the entire use case, combining the metadata, the textual steps, and the visual diagram into a single, professional artifact.
This report serves as a bridge between stakeholders, providing a well-structured reference that ensures everyone—from the client to the QA engineer—agrees on the system functionality.
Why You Should Automate Diagramming
Adopting an AI-driven approach to requirements engineering offers immediate tangible benefits for development teams.
- Speed & Efficiency: Transition from concept to visual artifact in minutes rather than hours. This eliminates the manual drudgery of dragging and dropping shapes in vector tools.
- Improved Clarity: Visuals are universal. Standardized diagrams bridge the gap between technical developers and non-technical business stakeholders, ensuring alignment.
- Reduced Errors: Visualizing logic helps identify gaps early. If the AI generates a diagram with a dead-end flow based on your text, you can spot the logical inconsistency immediately, saving costly rework later.
Tips and Tricks for Optimization
To get the best results from AI diagramming tools, consider these expert tips to refine your inputs and workflow.
- Use Atomic Sentences: When describing the flow in Step 2, keep sentences short and action-oriented (e.g., “User clicks Submit” rather than “The user decides to click the submit button to proceed”). AI parsers prefer direct subject-verb-object structures.
- Standardize Naming Conventions: Ensure you refer to actors and system components consistently throughout the text. Variation in naming (e.g., switching between “Client” and “Customer”) can confuse the generation logic.
- Iterate on Logic, Not Pixels: If the diagram looks wrong, do not try to fix the lines manually. Instead, refine the text description. This enforces a “docs-as-code” mentality where the requirement acts as the single source of truth.
Ready to streamline your workflow? Stop drawing diagrams by hand and let AI handle the complexity, allowing you to focus on building great software.