Most organizations treat the PEST analysis as a routine box-checking exercise. They list broad factors and move on to the next agenda item. This approach often leaves critical vulnerabilities exposed. A surface-level review captures the obvious, but it misses the nuance that defines long-term viability. To truly understand the external environment, you must peel back the initial layers and examine the underlying forces driving change. This guide explores how to transform a basic PEST framework into a robust strategic instrument.
Strategic assessment is not about predicting the future with certainty. It is about understanding the probability of various outcomes and preparing for them. When you deepen your analysis, you shift from reactive scrambling to proactive positioning. The following sections break down how to inject rigor into each component of the PEST model without relying on external tools or software products.
Understanding the Core Framework 🔍
PEST stands for Political, Economic, Social, and Technological. It is a macro-environmental scanning tool. The traditional view suggests a linear relationship: these factors exist, and you adapt to them. However, modern business environments are complex systems where these elements interact dynamically. A change in technology often triggers a shift in social behavior, which then invites political regulation.
Standard analysis often lists these factors in isolation. For example, noting a rise in inflation under Economic factors without linking it to labor costs or purchasing power under Social factors creates a fragmented view. Depth comes from recognizing these connections. It requires looking at the second-order effects of external changes rather than just the first-order symptoms.
When conducting this assessment, avoid generic statements. Instead of noting “political instability,” identify specific legislative risks. Instead of noting “technological change,” specify which technologies impact your core value proposition. Specificity allows for actionable strategy.
Deep Dive: Political Nuances 🏛️
The Political layer is frequently the most visible, yet it is often oversimplified. Leaders look at election cycles or major policy shifts. To add depth, you must analyze the regulatory ecosystem in detail. This involves understanding the mechanisms of governance, not just the outcomes.
- Regulatory Compliance Costs: It is not enough to know a law exists. You must estimate the cost of compliance. Does it require new software infrastructure? Does it require hiring specialized legal staff? These costs affect the bottom line directly.
- Geopolitical Tension: Trade wars, sanctions, and diplomatic disputes create supply chain friction. Assess how your suppliers are exposed to international borders. A disruption in one region can halt production in another.
- Corruption and Governance: In some markets, the written law differs from the operational reality. Understanding the corruption perception index helps in evaluating the risk of doing business in specific jurisdictions.
- Policy Continuity: Changes in administration do not always mean policy changes, but they can alter enforcement priorities. Assess the stability of the regulatory body itself, not just the government.
By examining these factors, you move beyond “will there be a new tax?” to “how will tax policy alter our capital expenditure strategy?” This distinction is crucial for financial planning.
Deep Dive: Economic Interdependencies 💰
Economic factors are often reduced to GDP growth rates or interest rates. While important, these aggregates hide significant volatility. A deep dive requires looking at the specific economic engines that drive your industry.
- Currency Fluctuation: If you import raw materials or export services, exchange rates are a direct profit driver. Analyze hedging strategies and exposure to specific currency pairs.
- Labor Market Dynamics: Unemployment rates tell only part of the story. Look at labor force participation rates and the skills gap. A low unemployment rate might indicate a shortage of talent, driving up wages beyond inflation.
- Supply Chain Liquidity: Economic health is often measured by the flow of goods. Assess the liquidity of your supply chain partners. A financially stable supplier in a strong economy might face credit crunches during a downturn.
- Energy and Resource Costs: Inflation is often driven by energy prices. Volatility in oil, gas, or water costs can disrupt operational models that were built on stable pricing assumptions.
Consider the impact of debt cycles. High interest rates might cool consumer spending, but they also increase the cost of capital for your own expansion projects. Understanding the cost of capital is as important as understanding consumer demand.
Deep Dive: Social Shifts 🧑🤝🧑
The Social layer is often treated as demographic data. However, culture and values evolve faster than population statistics. A deep understanding requires analyzing behavioral shifts and societal trust levels.
- Generational Values: Different generations prioritize different things. Younger cohorts may value sustainability and flexibility over job security. Older cohorts may prioritize stability and traditional benefits. Your workforce and customer base reflect these divides.
- Work-Life Balance: The shift toward remote work is not just a logistical change; it is a social contract change. It affects real estate needs, team culture, and productivity metrics.
- Health and Wellness: Post-pandemic, health consciousness has risen. This impacts insurance costs, product demand (e.g., wellness tech), and absenteeism rates.
- Trust in Institutions: When trust in media, government, or corporations declines, brand reputation becomes fragile. Consumers are more skeptical of marketing claims. Authenticity becomes a competitive advantage.
Demographics are the skeleton, but culture is the muscle. You need to understand the values that drive consumer decisions, not just the age of the consumers.
Deep Dive: Technological Trajectories 🤖
Technology is often listed as “AI” or “Cloud Computing.” This is too broad. You need to assess the adoption curve and the infrastructure required to support it.
- Adoption Barriers: Just because a technology exists does not mean it is usable. Consider the learning curve for your staff and the technical requirements for customers. Legacy system debt can prevent the adoption of new tools.
- Cybersecurity Risks: As digital dependency grows, so does the attack surface. Assess the security posture of your vendors. A breach in a third-party system can compromise your data.
- Data Privacy Regulations: Technology is often regulated by privacy laws. The collection and use of data is a political and social issue as much as a technical one. Non-compliance carries heavy fines.
- Automation Impact: Assess which roles are susceptible to automation. This affects your hiring strategy and the need for reskilling. It also impacts your pricing model if efficiency gains allow for lower costs.
Technology is an enabler, but it is also a disruptor. The question is not just “what can we build?” but “what are we replacing?” and “what does the market need next?”
The Web of Influence: Interconnectivity 🕸️
The true power of a deep PEST analysis lies in the connections between the four quadrants. Factors do not operate in silos. A technological breakthrough can alter social norms, which prompts political action, which influences economic incentives.
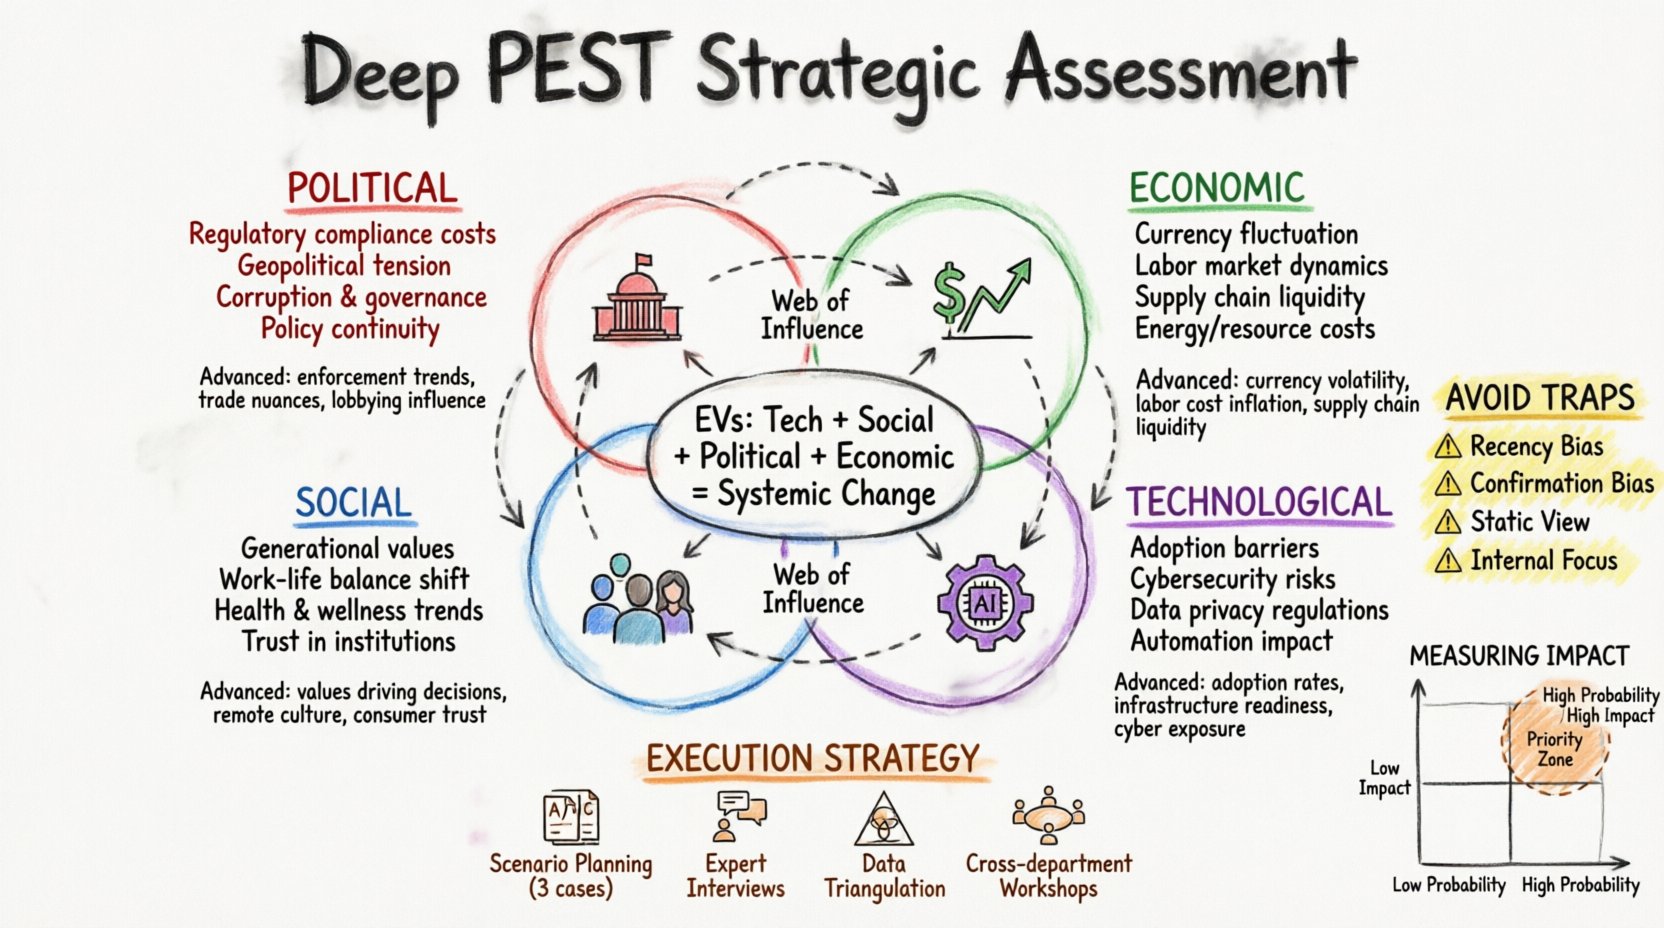
For instance, consider the rise of electric vehicles (EVs). Technological advancements in battery life make EVs viable. Social pressure regarding climate change drives consumer demand. Political subsidies and tax credits make them affordable. Economic shifts occur as oil demand drops and electricity grid capacity increases.
Mapping these interactions helps identify leverage points. If you can influence one area, it may cascade through the others. Conversely, a disruption in one area may require a coordinated response across all others.
Comparison of Standard vs. Advanced Factors
| Category | Standard Analysis | Advanced Deep Dive |
|---|---|---|
| Political | New tax laws | Regulatory enforcement trends, trade agreement nuances, lobbying influence |
| Economic | GDP Growth | Currency volatility impact, labor cost inflation, supply chain liquidity |
| Social | Population Age | Generational values, remote work culture, consumer trust levels |
| Technological | New Software | Adoption rates, infrastructure readiness, cybersecurity exposure |
Execution Strategy 📝
How do you conduct this analysis without specialized software? The process relies on human insight and data triangulation.
- Scenario Planning: Do not create one forecast. Create three: Best Case, Worst Case, and Most Likely. For each scenario, map how the PEST factors shift. This prepares you for volatility.
- Expert Interviews: Talk to people outside your organization. Industry analysts, former regulators, and supply chain partners can provide context that internal data misses.
- Data Triangulation: Cross-reference public data with internal metrics. If government data says employment is up, but your hiring freeze is due to lack of applicants, there is a discrepancy worth investigating.
- Workshops: Facilitate sessions where different departments challenge each other’s assumptions. Sales teams see social shifts; Finance teams see economic constraints. Combining these views creates a holistic picture.
Avoiding Common Analytical Traps 🚫
Even with a deep framework, human bias can skew the results. Awareness of these traps is essential for maintaining objectivity.
- Recency Bias: We tend to overvalue recent events. A major policy change last month might feel like a trend, but it could be an anomaly. Look at historical data to establish baselines.
- Confirmation Bias: We often look for evidence that supports our existing strategy. Actively seek data that contradicts your assumptions. If you believe the market is growing, find out where it is shrinking.
- Static View: The environment changes while you are analyzing it. Treat the assessment as a living document, not a one-time report. Schedule quarterly reviews to update the factors.
- Internal Focus: Do not let internal politics dictate the analysis. A department might claim a political risk is high to secure budget. Validate these claims with external data sources.
Measuring Impact 📊
Qualitative analysis is powerful, but it needs quantitative validation where possible. Assign probability scores to risks and potential impacts. This does not make the future predictable, but it makes the risk manageable.
For example, assign a probability of 10% to a specific trade policy change. Assign a financial impact of $5 million if it occurs. This helps prioritize which risks require immediate mitigation strategies. Focus resources on high-probability, high-impact factors.
Remember that not all factors can be quantified. Social trust or political stability are harder to measure. In these cases, use expert scoring systems. Have a panel of stakeholders rate the severity of the factor on a scale of 1 to 10. Aggregating these scores provides a consensus view.
Moving Forward 🚀
A strategic assessment is only as good as the decisions it informs. The goal is not to produce a document that sits on a shelf. It is to create a shared understanding of the environment that guides resource allocation.
By expanding the PEST analysis beyond the basics, you equip your organization with a clearer view of the horizon. You move from guessing to calculating. You move from reacting to preparing. This depth provides a competitive edge in volatile markets.
Start by auditing your current process. Are you listing factors or analyzing drivers? Are you looking at the four quadrants separately or together? The effort to add depth will pay dividends in the resilience of your strategy.