Enterprise Architecture (EA) often faces scrutiny regarding its direct financial contribution. While the strategic value is acknowledged, translating architectural decisions into tangible Return on Investment (ROI) remains a complex challenge. This guide provides a structured approach to quantifying the value of EA initiatives within the context of the TOGAF framework. By focusing on measurable outcomes, organizations can justify investments, align stakeholders, and ensure continuous improvement. 🏗️
🤔 The Challenge of Quantifying Architecture Value
Many organizations struggle to articulate the financial benefits of EA. The work often involves preventing future problems rather than generating immediate revenue. This creates a perception of EA as a cost center rather than a strategic asset. However, the cost of inaction is often far higher than the cost of implementation. Measuring ROI requires a shift in perspective from tracking activities to tracking outcomes.
To succeed, you must define value in terms that matter to the business. This involves identifying specific pain points that architecture addresses. Common areas of impact include:
- Operational Efficiency: Reducing redundancy and streamlining processes.
- Risk Mitigation: Avoiding compliance breaches and security vulnerabilities.
- Agility: Faster time-to-market for new products or services.
- Cost Reduction: Lowering technology maintenance and licensing expenses.
Without clear metrics, it is difficult to secure funding for future architectural work. A robust measurement framework bridges the gap between technical execution and business strategy. 📉
🔗 Aligning with the TOGAF Framework
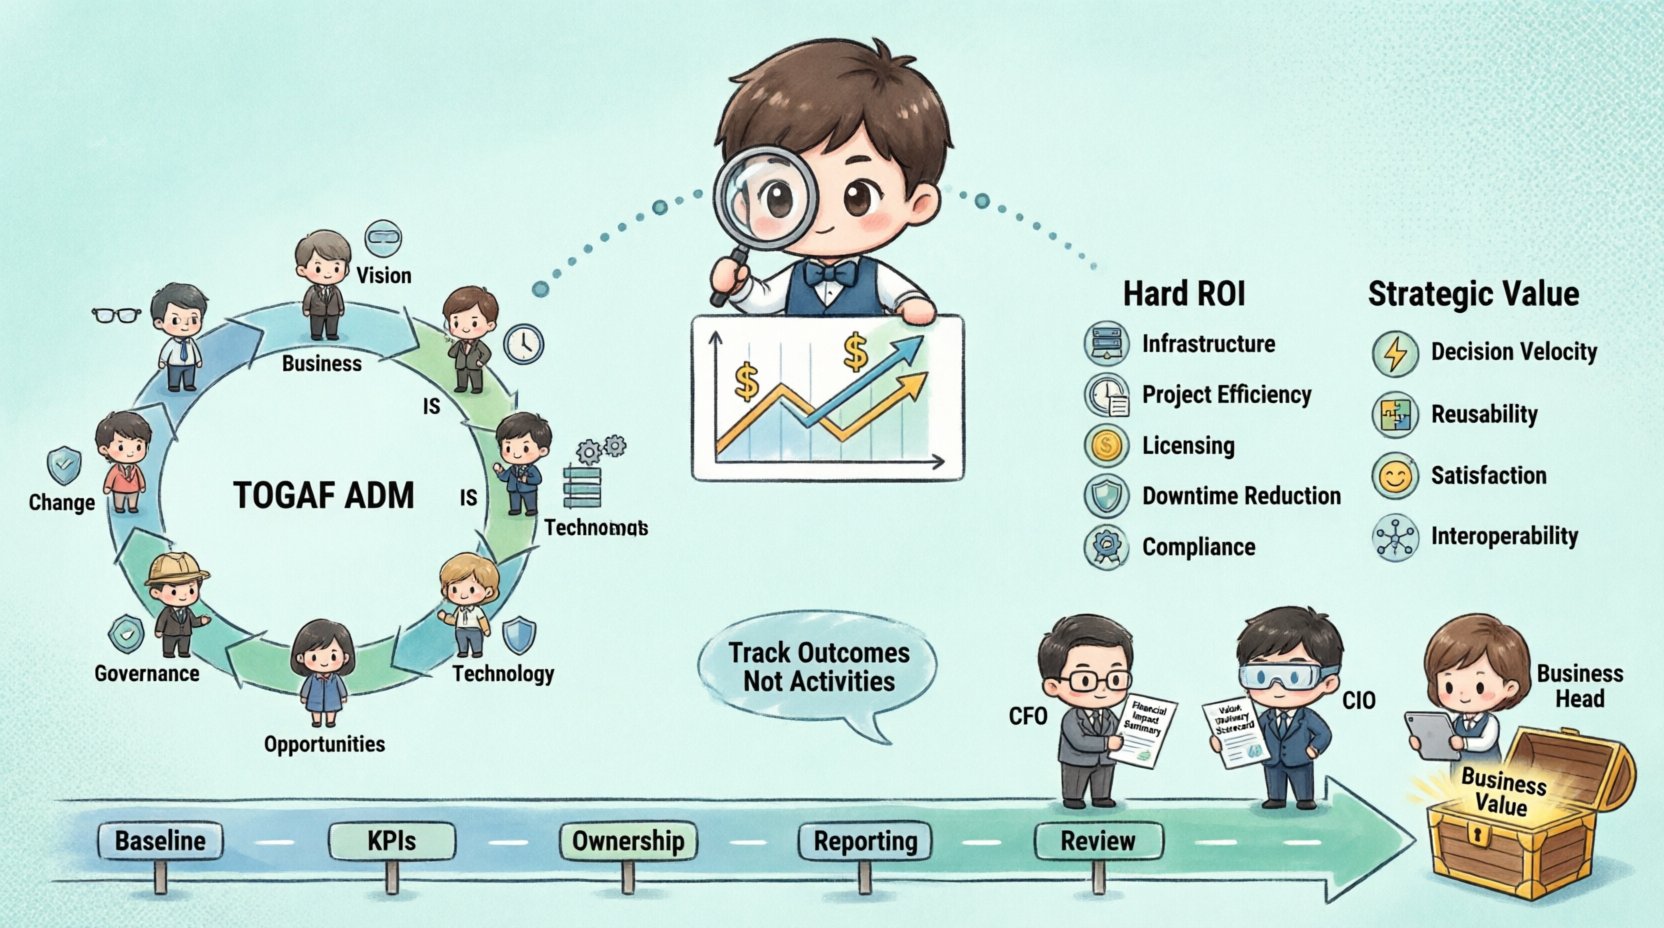
The TOGAF Architecture Development Method (ADM) provides a natural structure for embedding value measurement throughout the lifecycle. Each phase of the ADM offers opportunities to define and track specific indicators. Integrating ROI analysis into the ADM ensures that value is considered from the start, not just at the end.
Consider how different phases contribute to financial outcomes:
- Phase A (Architecture Vision): Define the business case and expected benefits. Identify key stakeholders and their success criteria.
- Phase B (Business Architecture): Analyze business processes to identify inefficiencies and waste.
- Phase C (Information Systems Architectures): Evaluate data and application landscapes for redundancy and integration costs.
- Phase D (Technology Architecture): Assess infrastructure costs and capacity planning requirements.
- Phase E (Opportunities and Solutions): Select migration options based on cost-benefit analysis.
- Phase G (Implementation Governance): Monitor adherence to the architecture to prevent cost overruns.
- Phase H (Architecture Change Management): Track the impact of changes on long-term viability and cost.
By mapping metrics to these phases, you create a traceable line from architectural activity to financial result. This alignment helps in reporting progress to the Architecture Board and executive leadership. 📈
💰 Quantitative Metrics for Hard ROI
Hard ROI refers to direct financial savings or revenue generation that can be measured with precision. These metrics are the most convincing for CFOs and finance teams. They rely on historical data and clear baselines.
1. Infrastructure Consolidation
One of the most direct ways EA delivers value is by reducing the number of servers, applications, and data centers. By standardizing technology stacks, organizations can negotiate better licensing terms and reduce maintenance overhead. Calculate the savings by comparing the total cost of ownership (TCO) before and after the initiative.
2. Project Delivery Efficiency
Architecture initiatives often aim to reduce project delivery time. Measure the average duration of IT projects before and after implementing standardized architectural patterns. A reduction in development time translates directly to labor cost savings. Use the formula:
- (Hours Saved per Project × Hourly Rate) × Number of Projects = Annual Savings
3. Licensing and Vendor Costs
EA helps identify duplicate software licenses and unused subscriptions. Conduct regular audits of the application portfolio. Consolidating tools can lead to significant reductions in annual spend. Track the total reduction in vendor contracts year-over-year.
4. Incident and Downtime Reduction
Robust architecture leads to more stable systems. Measure the reduction in Mean Time to Recovery (MTTR) and the frequency of outages. Calculate the cost of downtime per hour and multiply it by the reduction in incidents. This quantifies the value of reliability.
5. Compliance and Audit Costs
Non-compliance can result in fines and legal fees. By embedding compliance requirements into the architecture, you reduce the risk of penalties. Track the reduction in external audit hours and the avoidance of regulatory fines.
🧠 Qualitative Metrics for Strategic Value
Not all value is financial. Strategic benefits often take time to materialize but provide long-term competitive advantages. These qualitative metrics are essential for a holistic view of ROI. They require scoring or estimation but are critical for stakeholder buy-in.
| Metric Category | Definition | Measurement Method |
|---|---|---|
| Decision Velocity | Speed at which business decisions are approved based on architectural guidance. | Average days from proposal to approval |
| Reusability Rate | Percentage of solutions built using existing architectural assets. | Count of reusable components / Total components |
| Employee Satisfaction | Developer and IT staff satisfaction regarding tools and processes. | Survey scores (1-10) |
| System Interoperability | Ability of systems to exchange data without custom integration. | Number of integration points reduced |
These metrics highlight the health of the IT environment. They often correlate with employee retention and innovation capacity. High interoperability, for instance, allows new business units to launch services faster without waiting for custom builds.
📋 The Measurement Framework
Implementing a measurement framework requires discipline and consistency. It is not enough to collect data; you must define how it is collected, stored, and reported. Follow these steps to establish a robust system.
Step 1: Define the Baseline
Before measuring change, you must know the starting point. Document the current state of costs, processes, and performance. This baseline serves as the reference for all future comparisons. Without a baseline, ROI calculations are speculative.
Step 2: Identify Key Performance Indicators (KPIs)
Select metrics that align with business goals. Avoid vanity metrics that look good but do not impact the bottom line. Focus on indicators that leadership cares about, such as operational costs, risk levels, and time-to-market.
Step 3: Assign Ownership
Who is responsible for tracking the data? Designate owners for each KPI. This could be an EA manager, a finance partner, or a specific architect. Clear ownership ensures data is collected consistently and accurately.
Step 4: Establish Reporting Cadence
Report ROI findings regularly. Monthly reports may be too frequent for some metrics, while quarterly reviews are often ideal for strategic initiatives. Consistency builds trust in the data.
Step 5: Review and Adjust
Periodically review the metrics. Are they still relevant? Do they reflect the current business strategy? Adjust the framework as the organization evolves.
⚠️ Common Pitfalls to Avoid
Even with a solid plan, organizations often make mistakes when measuring EA value. Being aware of these pitfalls helps you maintain credibility and accuracy.
- Attributing all savings to EA: Avoid taking credit for savings that would have happened anyway. Be honest about the specific contribution of architectural decisions.
- Neglecting the cost of EA: ROI is a ratio of benefit to cost. If you ignore the cost of the architecture team and tools, the calculation is skewed. Include personnel, software, and training costs.
- Focusing only on short-term gains: Some architectural benefits, like improved security posture, may not show immediate financial returns. Consider the long-term risk avoidance value.
- Ignoring the Cost of Non-Architecture: Sometimes the biggest savings come from preventing a bad decision. Document the projects that were stopped or altered due to architectural guidance.
- Using vague terminology: Avoid terms like “improved efficiency” without defining what that means. Use specific numbers and units of measurement.
🗣️ Communicating Results to Stakeholders
Once you have the data, the next challenge is communication. Different stakeholders require different levels of detail and different types of information. Tailor your reporting to the audience.
For the CFO: Focus on financial metrics. Use terms like TCO, OpEx, CapEx, and Net Present Value. Provide clear charts showing cost trends over time.
For the CIO: Focus on technical health and delivery speed. Discuss infrastructure utilization, system uptime, and project velocity. Show how architecture reduces technical debt.
For Business Unit Heads: Focus on agility and customer impact. Explain how architecture enables faster feature releases and better user experiences. Avoid deep technical jargon.
Visual aids are powerful tools for communication. Use dashboards to display key metrics in real-time. A well-designed dashboard allows stakeholders to see progress without needing a detailed report. 📊
🔄 Continuous Improvement and Value Realization
Measuring ROI is not a one-time event. It is a continuous cycle of planning, execution, measurement, and refinement. As the business environment changes, so do the metrics that matter. An architecture that was valuable two years ago may need adaptation to remain relevant.
Implement a feedback loop where measurement results inform future architectural decisions. If a specific initiative does not yield the expected ROI, analyze why. Was the baseline incorrect? Was the implementation flawed? Or was the assumption about value flawed? Use these insights to refine the strategy.
Consider establishing an Architecture Value Board. This group reviews the ROI data and makes decisions on which initiatives to fund, pause, or terminate. This ensures that resources are allocated to the most valuable architectural work.
🛡️ Managing Risk as a Value Metric
Risk management is a critical component of EA value. While it is difficult to put a price tag on risk avoidance, it is a tangible benefit. Poor architecture often leads to security breaches, data loss, and regulatory fines.
Track the number of security vulnerabilities identified in the architecture review process. Compare this to the number of vulnerabilities that reach production. A reduction in production vulnerabilities indicates effective risk mitigation. You can estimate the potential cost of a breach and compare it to the cost of prevention.
Additionally, assess the impact of single points of failure. Architecture that eliminates single points of failure improves system resilience. Calculate the cost of potential downtime and the probability of occurrence to quantify this benefit.
🚀 Driving Innovation Through Architecture
Architecture is not just about stability; it is about enabling innovation. By creating flexible and modular systems, EA allows the business to experiment and adapt quickly. This agility is a form of value.
Measure the time it takes to integrate new technologies. A well-architected environment should allow for the rapid adoption of cloud services, AI tools, or new data platforms. Compare the integration time before and after architectural improvements.
Track the number of new business capabilities delivered using existing architectural assets. High reuse rates indicate a mature architecture that supports innovation without reinventing the wheel. This reduces development costs and accelerates time-to-market.
📝 Summary of Best Practices
To ensure success in measuring ROI for Enterprise Architecture, adhere to the following principles:
- Start with the Business: Always link architectural activities to business outcomes.
- Be Precise: Use specific data points rather than generalizations.
- Be Honest: Acknowledge limitations and uncertainties in the data.
- Be Consistent: Use the same methods over time to allow for trend analysis.
- Be Visible: Share results regularly with all relevant stakeholders.
- Be Strategic: Focus on long-term value, not just immediate cost cuts.
By following these guidelines, you transform EA from an abstract concept into a measurable business function. This shift is essential for securing the resources needed to build a resilient and agile organization. The goal is not just to measure success, but to ensure it. 🎯
🌟 Final Thoughts on Value Delivery
Measuring ROI on Enterprise Architecture initiatives is a journey that requires patience and precision. It involves balancing quantitative data with qualitative insights. It requires collaboration between architects, finance teams, and business leaders. When done correctly, it provides a clear picture of the investment return.
The ultimate goal is to create an environment where architecture is viewed as a driver of business success. By demonstrating clear value, you build the trust necessary to influence strategic decisions. This trust is the foundation of a successful Enterprise Architecture practice. Keep refining your methods and stay focused on the business outcomes that matter most.