In today’s global business environment, stability is no longer the default state. Organizations face constant shifts in geopolitical tension, economic inflation, social expectations, and technological disruption. Traditional strategic planning often relies on linear projections, which fail when the ground beneath them shakes. This is where a robust PEST analysis becomes essential. It provides a structured lens to examine the external macro-environmental factors that influence an organization’s performance. However, static analysis is insufficient for modern volatility. The real power lies in simulating scenarios based on these factors to prepare for multiple futures. 📈
This guide explores how to leverage PEST analysis not just as a reporting tool, but as a dynamic mechanism for stress-testing strategy. We will examine each component of the framework, discuss methods for scenario modeling, and outline how to integrate these insights into resilient planning processes without relying on specific software products. 🔍
🏛️ Understanding the Core Framework
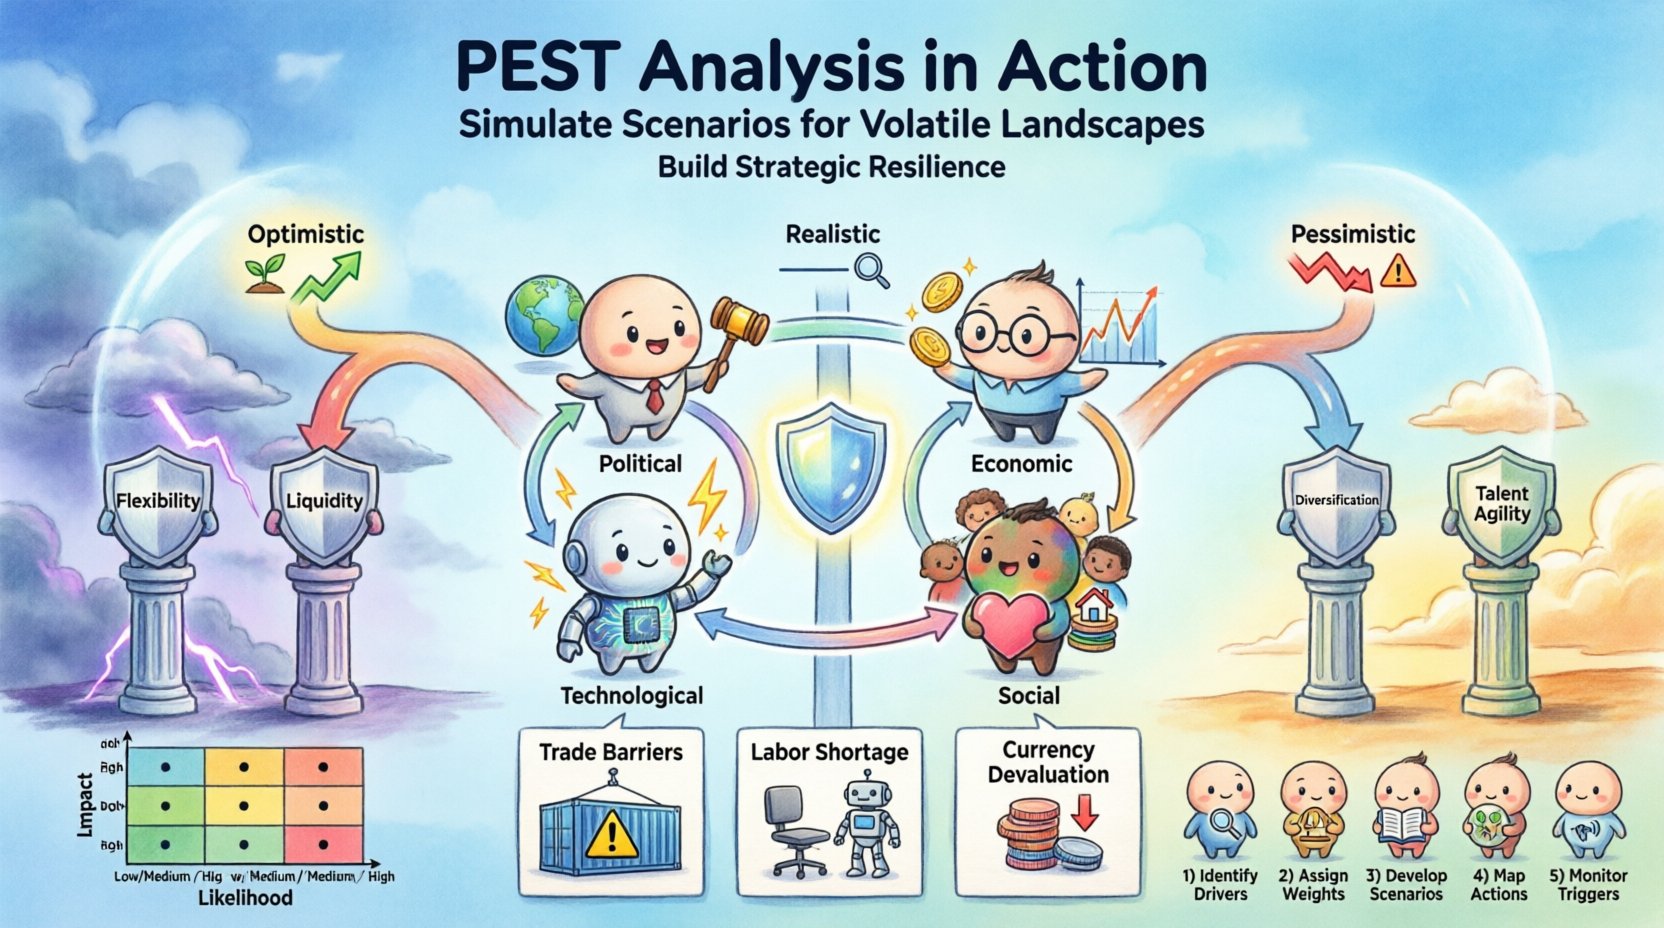
The PEST framework stands for Political, Economic, Social, and Technological. It is a foundational model used to identify external factors that drive change. While often taught as a static checklist, its true utility emerges when treated as a living system of variables. Each category represents a distinct pressure point that can alter market conditions overnight.
- Political: Government policies, trade restrictions, tax laws, and political stability.
- Economic: Growth rates, exchange rates, inflation, and interest rates.
- Social: Demographics, cultural trends, health consciousness, and lifestyle changes.
- Technological: Innovation rates, automation, R&D activity, and technology incentives.
When the landscape is volatile, these factors do not move in isolation. A political decision can trigger economic shifts, which then alter social behaviors, eventually accelerating technological adoption. Understanding these interdependencies is crucial for accurate scenario simulation.
⚖️ Deep Dive into Political Factors
Political stability is the bedrock of business continuity. In volatile times, government actions become unpredictable. Trade wars, sanctions, and regulatory overhauls can reshape entire industries overnight. When conducting a political analysis, one must look beyond the current administration and consider the structural resilience of the political system.
Key Considerations for Simulation:
- Regulatory Burden: How might new compliance requirements increase operational costs?
- Geopolitical Risk: What happens if trade routes are disrupted by conflict?
- Tax Policy: Are there imminent changes to corporate tax rates that affect cash flow?
- Political Stability: Is the region prone to civil unrest or regime change?
To simulate these scenarios, teams should define specific political events and assign probabilities to them. For example, a high tariff implementation might be a low-probability event but with catastrophic impact. Conversely, a gradual increase in labor regulations might be high probability with moderate impact.
Table: Political Risk Assessment Matrix
| Factor | Impact Level | Probability | Strategic Response |
|---|---|---|---|
| Trade Tariffs | High | Medium | Diversify supply chain |
| Regulatory Change | Medium | High | Update compliance protocols |
| Political Instability | Critical | Low | Establish exit strategy |
| Tax Reform | Medium | Medium | Adjust financial forecasting |
📉 Economic Shifts and Predictive Modeling
Economic volatility is perhaps the most immediate driver of business risk. Inflation erodes purchasing power, while fluctuating exchange rates impact international margins. Interest rate changes affect capital costs and investment viability. Unlike political factors, economic indicators are often quantifiable, yet their correlation to business outcomes can be non-linear.
Simulating Economic Scenarios:
- Stagflation: A scenario where growth stalls while inflation rises. This requires cost-cutting measures without sacrificing quality.
- Recession: Demand contraction necessitates liquidity management and inventory reduction.
- Boom: High demand may strain supply chains, requiring rapid scaling capabilities.
- Currency Fluctuation: Hedging strategies become vital when operating across borders.
When modeling these factors, it is important to stress-test the balance sheet. Ask how much revenue loss the organization can absorb before liquidity is threatened. This exercise reveals the true resilience of the financial model. It moves the discussion from “what if sales drop?” to “how long can we operate with 20% less cash flow?”
Furthermore, economic data should be contextualized. A national GDP figure might look stable while sector-specific indicators show decline. Niche analysis often reveals risks that macro data obscures. For instance, a technology sector might thrive during a general economic downturn if digital transformation accelerates.
👥 Social Dynamics in Changing Times
Social factors encompass the demographic and cultural environment. These are often slower-moving than economic shifts, but when they do change, the impact is profound. Workforce expectations, consumer values, and population health trends dictate long-term demand.
In a volatile landscape, social shifts can accelerate. For example, a global health crisis can rapidly alter work habits, forcing a permanent shift to remote operations. Demographic aging can shrink the labor pool, driving up wages and forcing automation adoption.
Key Social Variables:
- Demographics: Aging populations vs. youth bulges.
- Cultural Norms: Shifts in consumer ethics or sustainability demands.
- Education Levels: Availability of skilled labor.
- Health Trends: Public health infrastructure and wellness priorities.
Simulation here involves asking how customer behavior might shift under stress. If disposable income falls due to economic pressure, do customers downgrade to premium or budget tiers? If remote work becomes permanent, does the need for commercial real estate vanish? These questions help shape the “What If” narratives.
🚀 Technological Disruption as a Variable
Technology is often the wildcard in strategic planning. Disruptive innovations can render established business models obsolete in months. In volatile environments, the pace of technological change can accelerate due to necessity.
Factors to Monitor:
- Innovation Rate: How quickly are competitors adopting new tools?
- Automation: Can processes be scaled down or up without linear cost increases?
- Data Security: Rising cyber threats in unstable digital ecosystems.
- Infrastructure: Reliability of power, internet, and logistics networks.
Scenario planning for technology involves assessing the threat of disruption. Is there a new entrant that could undercut pricing through efficiency? Is a legacy system becoming a liability? The goal is not to predict the next big thing, but to prepare for the possibility that the current way of working will no longer be viable.
🧩 Integrating PEST with Strategic Planning
Collecting data is only the first step. The integration of PEST findings into strategy requires a structured approach to decision-making. This process ensures that external analysis informs internal action.
Steps for Integration:
- Identify Critical Drivers: Not all factors are equally important. Select the top three political, economic, social, and technological drivers that will impact the business most significantly.
- Assign Weights: Determine which factors carry the most weight in decision-making. A change in tax law might matter more than a shift in social media trends.
- Develop Scenarios: Create distinct narratives (e.g., Optimistic, Pessimistic, Realistic) based on combinations of these drivers.
- Map Actions: For each scenario, define the specific actions required to maintain viability.
- Monitor Triggers: Establish indicators that signal which scenario is unfolding. This allows for timely pivots.
This integration transforms the analysis from a report on the shelf into a living dashboard for management. It ensures that leadership is constantly aware of the external context.
🛡️ Building Resilience Through Analysis
Resilience is the capacity to recover quickly from difficulties. In the context of PEST analysis, resilience means having a strategy that holds up under adverse conditions. It is not about predicting the future perfectly, but about being prepared for a range of possibilities.
Strategies for Resilience:
- Flexibility in Operations: Maintain supply chains that can reroute quickly.
- Liquidity Management: Keep cash reserves to weather economic downturns.
- Diversification: Avoid reliance on a single market or customer segment.
- Talent Agility: Invest in skills training so the workforce can adapt to new technologies.
By simulating worst-case scenarios, organizations can identify their breaking points. If a specific political sanction would halt operations, the mitigation plan must be in place before the sanction occurs. This proactive stance reduces panic during actual crises.
🚧 Common Pitfalls to Avoid
Even with a robust framework, errors in execution can lead to flawed strategies. Awareness of common pitfalls helps maintain the integrity of the analysis.
- Confirmation Bias: Focusing only on data that supports existing beliefs. Seek out contradictory evidence to challenge assumptions.
- Static Analysis: Treating PEST as a one-time exercise. The environment changes, so the analysis must be updated regularly.
- Ignoring Interconnections: Analyzing factors in silos. Political decisions often drive economic outcomes. Social trends influence technological adoption.
- Data Overload: Collecting too much information without synthesis. Focus on actionable insights rather than raw data.
- Short-Term Focus: Prioritizing immediate gains over long-term structural shifts. Volatility often reveals long-term trends faster.
📊 Case Study Scenarios
Consider a hypothetical manufacturing company operating in a region experiencing political tension and economic inflation. How would they apply this framework?
Scenario A: Escalating Trade Barriers
- Political: New tariffs imposed on raw materials.
- Economic: Cost of goods sold increases by 15%.
- Response: Shift sourcing to domestic suppliers or negotiate long-term fixed-price contracts.
Scenario B: Labor Shortage
- Social: Demographic shift reduces available workforce.
- Technological: Automation becomes necessary to maintain output.
- Economic: Wages rise due to scarcity.
- Response: Invest in robotics and upskill existing staff for higher-value tasks.
Scenario C: Currency Devaluation
- Economic: Local currency loses value against trading partners.
- Political: Government devalues currency to boost exports.
- Response: Hedge currency exposure and adjust pricing strategies for international markets.
These examples illustrate how PEST factors combine to create specific challenges. The organization does not need to predict which scenario will happen, but it must have a plan for each.
🔮 The Future of Strategic Foresight
As global systems become more interconnected, the complexity of external factors will continue to rise. The ability to simulate scenarios based on PEST analysis will become a core competency for leaders. It moves the organization from reactive to proactive.
Success in this environment depends on data literacy and critical thinking. Leaders must be comfortable with uncertainty and willing to pivot based on new information. The framework is not a crystal ball, but a compass. It does not tell you exactly where you will go, but it helps you navigate the terrain effectively.
By maintaining a disciplined approach to analyzing political, economic, social, and technological factors, organizations can build strategies that withstand volatility. This requires commitment, regular review, and the courage to change course when the data demands it. The goal is not control over the environment, but adaptability within it. 🛡️🌱