In the landscape of modern Systems Engineering, complexity is the only constant. As systems grow in scope and interconnectivity, the need for precise, standardized communication becomes critical. Systems Modeling Language (SysML) stands as the standard for Model-Based Systems Engineering (MBSE). It provides a visual syntax that bridges the gap between abstract requirements and concrete design. However, a powerful language is only as effective as the diagrams used to articulate it. Selecting the right diagram type is not merely a stylistic choice; it is a strategic decision that impacts clarity, traceability, and validation.
This guide explores the nine core diagram types available within SysML. We will examine their specific strengths, limitations, and ideal applications. By understanding the unique capabilities of each diagram, engineering teams can structure their models to address specific challenges without introducing unnecessary noise or ambiguity. ⚙️
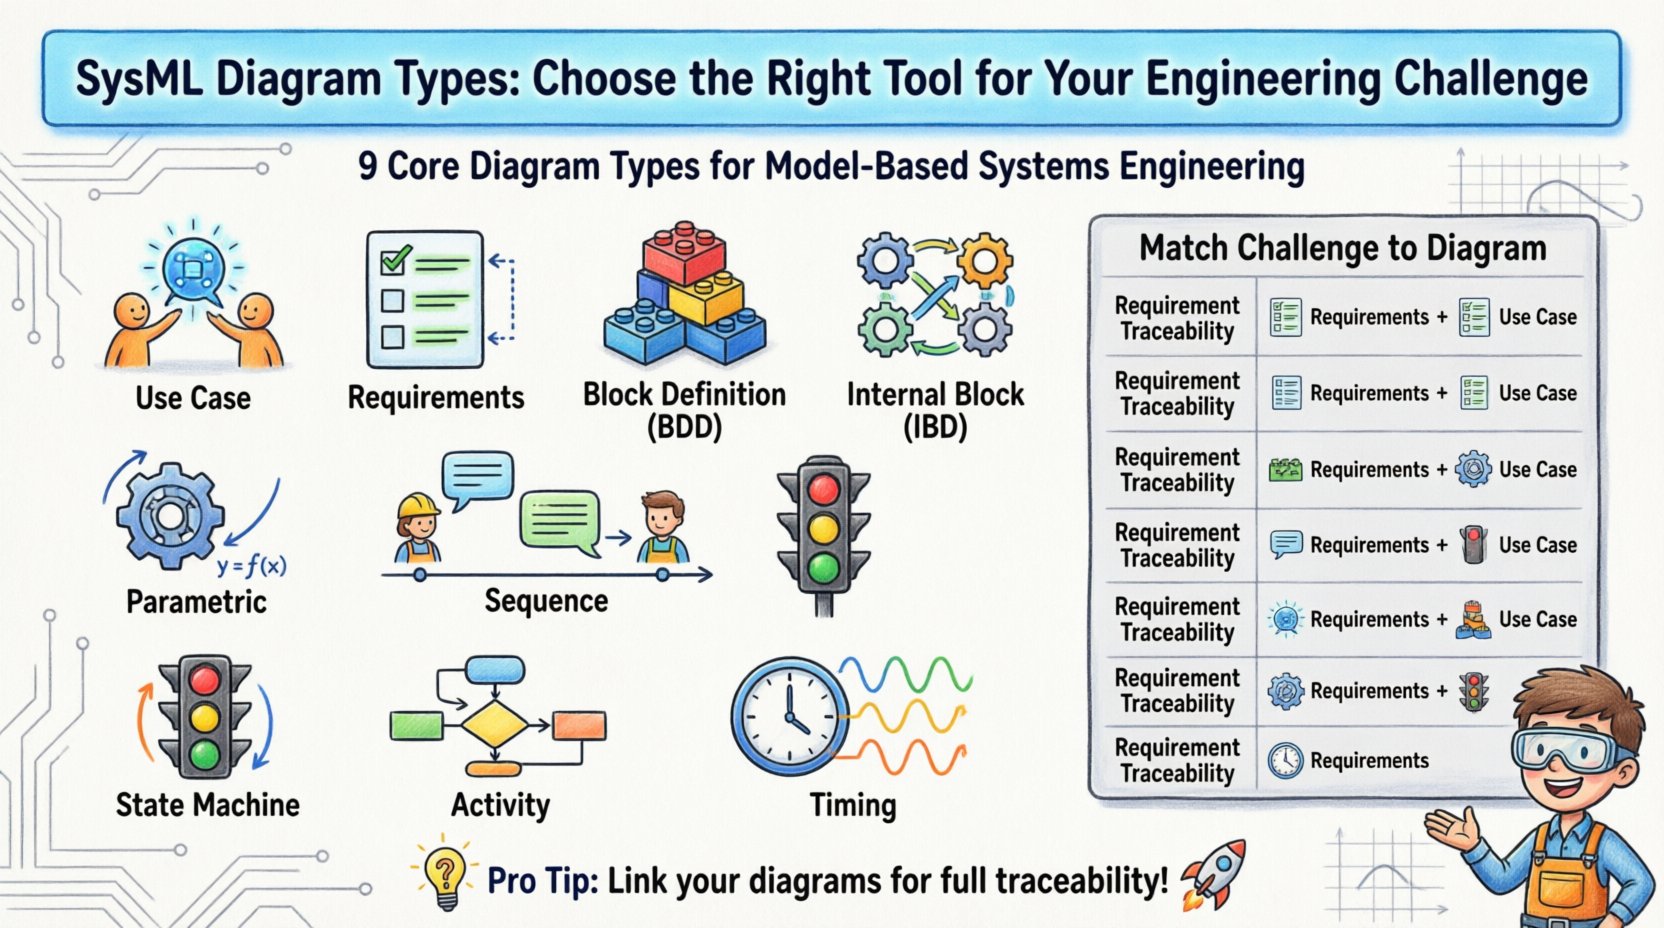
Understanding the Core SysML Diagram Types 📊
SysML organizes its visual notation into several distinct categories. Each serves a specific purpose in the modeling lifecycle. Below is a detailed breakdown of each diagram type, focusing on what it represents and how it fits into the broader engineering context.
1. Use Case Diagram 📋
The Use Case diagram captures the functional interactions between a system and its external actors. It answers the question: What does the system do for the user or other systems?
- Primary Elements: Actors (external entities), Use Cases (functional goals), and Associations.
- Best Used For: High-level requirement elicitation and user story definition.
- Engineering Challenge: Defining the scope of functionality without diving into internal logic.
- Limitations: It does not show how the function is implemented, only that it exists.
When starting a project, the Use Case diagram sets the boundary conditions. It helps stakeholders agree on the system’s purpose before technical design begins. It is particularly useful during the early phases of requirements gathering to ensure no critical user interaction is overlooked.
2. Requirements Diagram 📝
Requirements management is the backbone of verification and validation. The Requirements diagram provides a dedicated view for capturing, organizing, and tracing system needs.
- Primary Elements: Requirement blocks, derived requirements, satisfaction relations, and refinement relations.
- Best Used For: Traceability matrices and ensuring every design element supports a valid need.
- Engineering Challenge: Managing complex hierarchies of requirements across subsystems.
- Limitations: It is a text-heavy diagram and does not show dynamic behavior or structural connections.
In regulated industries, traceability is non-negotiable. This diagram ensures that every requirement is linked to a design element, and every design element can be traced back to a requirement. It serves as the single source of truth for what the system must achieve.
3. Block Definition Diagram (BDD) 🧱
The Block Definition Diagram is the structural foundation of SysML. It defines the composition of the system by breaking it down into blocks and their relationships.
- Primary Elements: Blocks, reference properties, value properties, and relationships (aggregation, composition, generalization).
- Best Used For: High-level system architecture and component hierarchy.
- Engineering Challenge: Defining the static structure and ownership of system parts.
- Limitations: It lacks detail on internal connections and ports.
Think of the BDD as the blueprint for the system’s skeleton. It defines the “what” in terms of physical or logical components. It is essential for understanding the top-level decomposition of the system and how major subsystems relate to one another.
4. Internal Block Diagram (IBD) 🕸️
Once the blocks are defined, the Internal Block Diagram details how they interact internally. It moves from the “what” to the “how” regarding connections.
- Primary Elements: Parts, ports (flow and item), connectors, and constraints. Best Used For: Interface definition and data flow between components.
- Engineering Challenge: Managing interface control documentation and signal routing.
- Limitations: Does not show the internal logic or behavior of the blocks themselves.
The IBD is critical for interface management. It specifies exactly what data or energy flows between blocks. This is where the system architecture becomes tangible. It ensures that the output of one component matches the input of another, preventing integration errors during assembly.
5. Parametric Diagram ⚙️
Parametric diagrams are the most mathematically intensive diagram type in SysML. They allow engineers to perform analysis on system performance, constraints, and physical properties.
- Primary Elements: Constraints, constraint properties, and binding connectors.
- Best Used For: Performance analysis, sizing, and trade-off studies.
- Engineering Challenge: Verifying that physical limits are not exceeded under various conditions.
- Limitations: Requires solver integration and can become computationally expensive for complex models.
This diagram type transforms the model from a visual representation into a simulation engine. It is used to calculate thermal loads, power consumption, or mass properties. It bridges the gap between design intent and physical reality.
6. Sequence Diagram 🔄
The Sequence diagram visualizes interactions over time. It shows how objects or components exchange messages to achieve a specific goal.
- Primary Elements: Lifelines, messages (calls, returns, signals), and activation bars.
- Best Used For: Defining operational sequences and data exchange timing.
- Engineering Challenge: Debugging logic errors in system workflows.
- Limitations: Can become cluttered if too many lifelines are involved; less effective for complex state logic.
Sequence diagrams are invaluable for understanding the temporal aspect of system operation. They help engineers visualize the order of events, ensuring that a sensor reads data before a controller processes it. They are particularly useful for software integration and communication protocol definition.
7. State Machine Diagram 🚦
State Machine diagrams model the lifecycle of a system or component. They define how the system responds to events based on its current condition.
- Primary Elements: States, transitions, events, and guards.
- Best Used For: Logic-heavy systems, safety mechanisms, and control flows.
- Engineering Challenge: Ensuring all possible states are accounted for and no deadlocks occur.
- Limitations: Can become complex with high concurrency; difficult to represent parallel states without decomposition.
For systems where logic dictates operation (e.g., safety systems, flight control), the State Machine diagram is essential. It explicitly defines the rules for changing modes, ensuring that the system does not enter an invalid state.
8. Activity Diagram 🏃
Activity diagrams describe the flow of control and data within a system. They are similar to flowcharts but with a stronger emphasis on concurrent behavior.
- Primary Elements: Nodes, edges, actions, and control flows.
- Best Used For: Complex business processes or algorithmic logic.
- Engineering Challenge: Optimizing workflow efficiency and identifying bottlenecks.
- Limitations: Less intuitive than State Machines for discrete event systems.
When the focus is on the flow of work rather than the state of the object, Activity diagrams are the tool of choice. They help in understanding how data moves through a process and where decision points exist.
9. Timing Diagram ⏱️
Timing diagrams focus on the behavior of objects over time. They are used to analyze the timing constraints and synchronization of system operations.
- Primary Elements: Time scales, states, and events.
- Best Used For: Real-time systems and hardware synchronization.
- Engineering Challenge: Ensuring timing constraints are met in high-speed environments.
- Limitations: Can be very specific to hardware timing and may not apply to high-level logical models.
Timing diagrams are specialized tools for engineering teams dealing with hard real-time requirements. They allow for precise measurement of response times and synchronization points.
Strategic Comparison: Matching Diagrams to Challenges 🛠️
Selecting the right diagram depends on the specific engineering challenge at hand. Using a State Machine diagram for a simple interface definition, for example, adds unnecessary complexity. Conversely, using a Use Case diagram for performance analysis will yield no results. The following table provides a quick reference for mapping challenges to diagram types.
| Engineering Challenge | Primary Diagram | Supporting Diagrams | Key Objective |
|---|---|---|---|
| Requirement Traceability | Requirements Diagram | Use Case Diagram | Link needs to design |
| System Architecture Definition | Block Definition Diagram | Internal Block Diagram | Define structure and hierarchy |
| Interface Control | Internal Block Diagram | Sequence Diagram | Define ports and flows |
| Performance Verification | Parametric Diagram | Activity Diagram | Validate constraints |
| Logic and Control Flow | State Machine Diagram | Activity Diagram | Define states and transitions |
| Operational Workflow | Sequence Diagram | Use Case Diagram | Define interaction order |
| Real-Time Timing | Timing Diagram | State Machine Diagram | Measure response times |
Deep Dive: Specific Engineering Scenarios 🧪
To fully appreciate the utility of these diagrams, we must look at how they solve real-world engineering problems. The following scenarios illustrate the practical application of SysML diagram selection.
Scenario 1: Managing Complex Interfaces 🌐
When designing a system with multiple subsystems, interface management becomes a major risk. A common failure point is assuming compatibility between components that do not match.
- Approach: Use the Internal Block Diagram to explicitly define ports for every interface.
- Implementation: Assign specific flow types to each port (e.g., electrical, hydraulic, data).
- Benefit: The model automatically checks for compatibility. If a signal type is passed to a port expecting data, the model flags an error.
- Traceability: Link these interfaces back to Requirement Diagrams to ensure the interface definition meets the stakeholder need.
Scenario 2: Safety Critical Logic 🛡️
In aerospace or medical devices, the system must fail safely. Logic errors can have catastrophic consequences. A simple flowchart is often insufficient to capture all failure modes.
- Approach: Use the State Machine Diagram to model the operational modes (Normal, Degraded, Emergency).
- Implementation: Define guards on transitions that verify safety conditions. For example, a transition from “Normal” to “Safe” only occurs if specific sensors confirm a fault.
- Benefit: Visualizes the safety logic clearly. It prevents the system from entering an unsafe state even if a single input is erroneous.
- Traceability: Map safety requirements directly to state transitions to prove compliance.
Scenario 3: Performance and Thermal Analysis 🔥
Electrical systems often face thermal constraints. Designers need to ensure that power consumption does not exceed the cooling capacity.
- Approach: Use the Parametric Diagram to define the mathematical relationships between power, heat, and temperature.
- Implementation: Bind constraint properties to the block parameters defined in the Block Definition Diagram.
- Benefit: Enables what-if analysis. Engineers can adjust power values and see the immediate impact on temperature without physical prototyping.
- Traceability: Link performance requirements to the constraint equations.
Integration and Traceability: The Connective Tissue 🕸️
A common pitfall in systems engineering is creating isolated diagrams. Each diagram type should not exist in a vacuum. The true power of SysML lies in the traceability links that connect them.
- Requirements to Structure: Ensure every requirement is linked to a block in the BDD or IBD. This confirms that the structure exists to meet the need.
- Behavior to Requirements: Link behavior diagrams (Sequence, State, Activity) to requirements. This ensures the logic is driven by need.
- Structure to Behavior: Link the blocks in the BDD to the lifelines in the Sequence diagram. This confirms that the interaction happens between the defined components.
- Constraints to Structure: Link Parametric constraints to the properties of the blocks. This ensures the math applies to the physical object.
Without these links, the model becomes a collection of drawings rather than a coherent system definition. Traceability allows for impact analysis. If a requirement changes, the model can identify which blocks, behaviors, and constraints are affected.
Best Practices for Model Maintenance 📚
Building the model is only half the battle. Maintaining it throughout the lifecycle requires discipline. As systems evolve, the diagrams must evolve with them.
- Keep Diagrams Focused: Avoid cramming every diagram. If a diagram becomes too crowded, it has lost its clarity. Split it into sub-diagrams.
- Standardize Notation: Ensure all engineers use the same naming conventions and symbol definitions. Consistency reduces cognitive load.
- Regular Reviews: Conduct model reviews similar to design reviews. Verify that the diagrams match the current design intent.
- Version Control: Treat the model as code. Use version control to track changes to the diagram structure over time.
- Automated Validation: Where possible, use tools to check for orphaned requirements or broken links. This reduces manual verification effort.
Common Pitfalls to Avoid ⚠️
Even experienced engineers can fall into traps when using SysML. Awareness of these common issues can save significant time.
- Over-Modeling: Creating detailed diagrams for every minor feature can lead to model bloat. Focus on the critical paths and high-risk areas.
- Under-Modeling: Skipping the Requirements diagram in favor of a spreadsheet often leads to traceability gaps. Do not underestimate the value of a dedicated requirements view.
- Mixing Abstraction Levels: Do not mix high-level architecture with low-level logic in the same diagram. Keep layers distinct.
- Ignoring Ports: In IBDs, failing to define ports correctly leads to ambiguity about how data flows. Be explicit about input and output directions.
- Static Constraints: In Parametric diagrams, failing to update constraints when design parameters change leads to false validation results. Keep the math current.
The Value of Precision in Modeling 🎯
Choosing the right SysML diagram is an exercise in precision. It is about selecting the tool that best reveals the specific aspect of the system under investigation. By adhering to the strengths of each diagram type, engineering teams can reduce ambiguity and improve the quality of their designs.
The goal is not to use all nine diagram types in every project. It is to use the right ones to solve the problem at hand. A robust model is one where every element serves a purpose and is connected to the broader system context. This disciplined approach leads to systems that are not only functional but also verifiable and maintainable.
As the industry moves toward more complex, integrated systems, the ability to model these systems clearly becomes a competitive advantage. SysML provides the syntax; the engineering team provides the discipline. Together, they create a digital thread that runs from the initial concept to the final product.
By prioritizing clarity over complexity, teams can leverage the full potential of Model-Based Systems Engineering. The diagrams become a shared language that aligns stakeholders, reduces risk, and accelerates development. This is the essence of effective systems modeling.
Ultimately, the success of a SysML project depends on the team’s ability to match the diagram to the challenge. Whether managing requirements, defining interfaces, or analyzing performance, the right visual representation provides the clarity needed to move forward with confidence. 🚀