Creating clear visual representations of system behavior is a cornerstone of successful software development. When teams struggle to align on what a system must do, confusion arises, leading to rework and delayed delivery. Use Case Diagrams offer a structured way to map out functional requirements from the perspective of external users. This guide explores how to construct these diagrams with precision, ensuring stakeholders understand the system’s capabilities without ambiguity.
Whether you are defining the scope for a new application or refining an existing product, the ability to visualize interactions is vital. We will examine the core components, relationship types, and best practices that lead to robust requirement modeling. The goal is not merely drawing shapes but communicating complex logic through simple visuals.
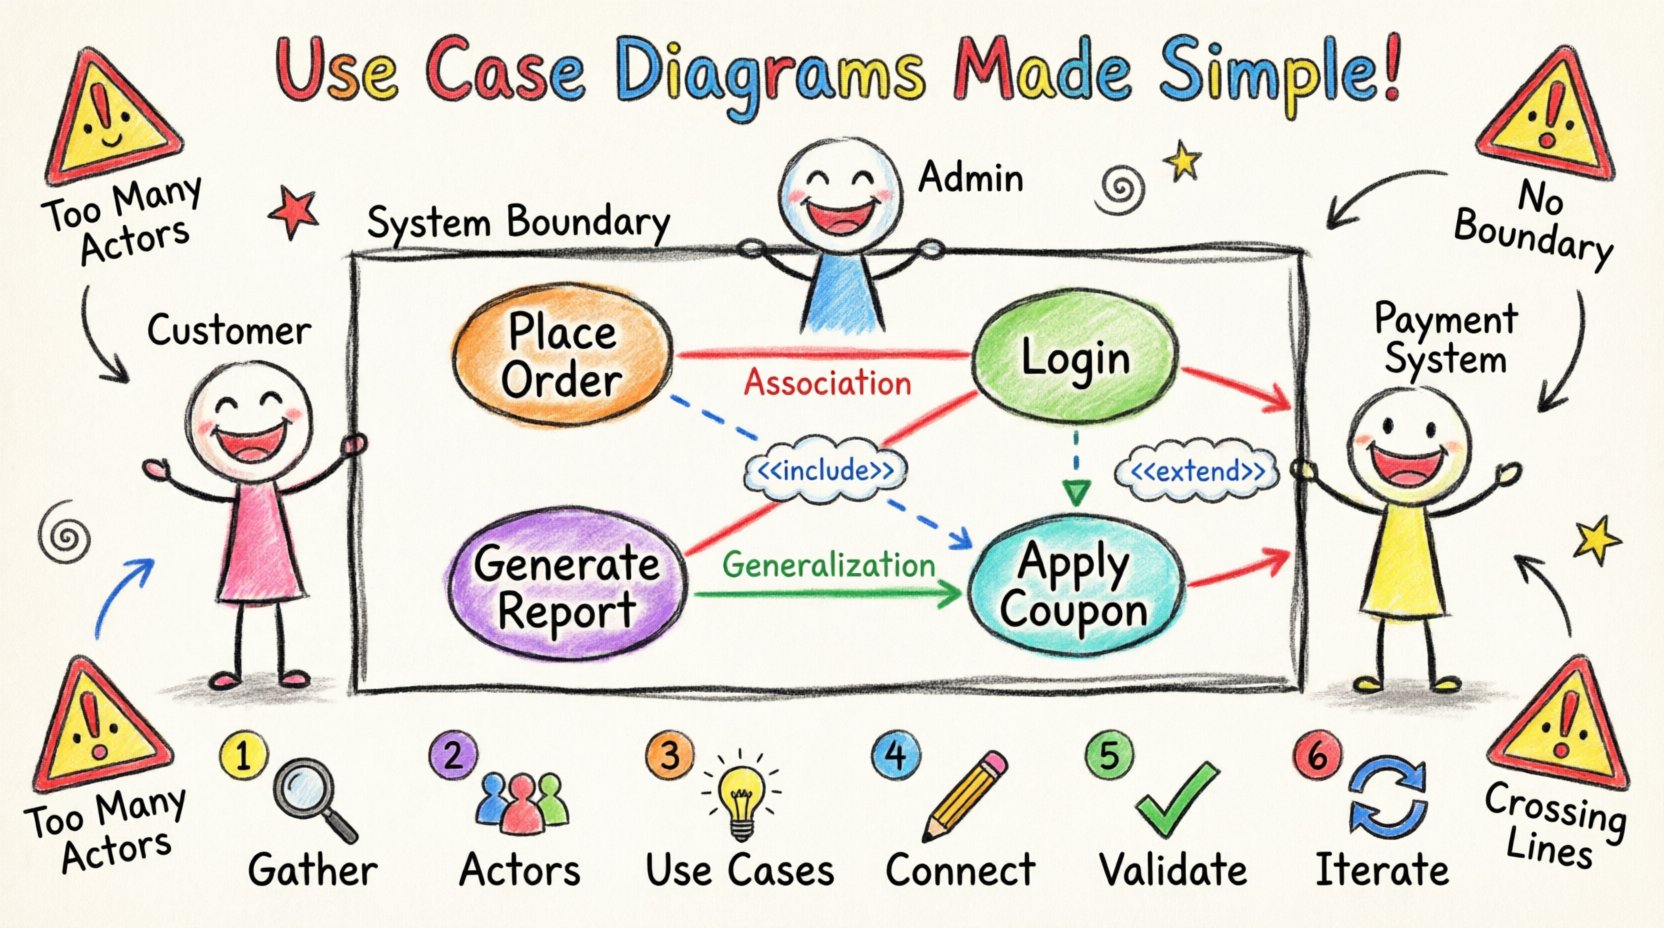
Understanding the Core Components 🧩
Before drawing lines and boxes, it is necessary to define the building blocks. A Use Case Diagram consists of specific elements that represent the system and its environment. Each element serves a distinct purpose in the overall model.
- Actors: These represent the users or external systems that interact with the software. Actors are depicted as stick figures or icons. They are not people themselves, but rather roles played by people or other systems.
- Use Cases: Represented as ovals, these define a specific goal or function the system performs. A use case is a complete unit of functionality, such as “Place Order” or “Generate Report”.
- System Boundary: A rectangle that encloses the use cases. This defines the scope of the system. Anything outside this box is considered external to the system.
- Relationships: Lines connecting actors to use cases, or use cases to other use cases. These lines define how the actors interact with the functions.
Clarity in these definitions prevents scope creep. If a feature does not fit within the system boundary or does not have a clear actor, it may not belong in this specific model. Keeping the diagram focused ensures that the requirements remain manageable.
Identifying Actors and Roles 👥
One of the most common challenges in diagramming is determining who the actors are. It is tempting to list every individual who might touch the system, but this creates clutter. Instead, focus on roles.
- Primary Actors: These initiate the use case to achieve a specific goal. For example, a “Customer” initiating a purchase.
- Secondary Actors: These are systems or services that provide information or resources to the system but do not initiate the primary flow. An example might be a “Payment Gateway” or “Inventory Database”.
- Generalized Actors: Sometimes multiple actors share the same responsibilities. In this case, you can create a general actor and have specific actors inherit from it to reduce complexity.
When identifying actors, ask yourself: Who triggers this action? Who receives the result? If an entity does not trigger or receive, it likely does not need to be an actor in this diagram. This discipline keeps the model clean.
Defining System Boundaries 🚧
The system boundary is the line in the sand. It separates what the system does from what the environment does. Drawing this box requires careful consideration of the project scope.
- Inclusion: Any functionality required to meet the business goal should be inside the box.
- Exclusion: Hardware maintenance, user training, or physical delivery processes usually sit outside the boundary unless they are automated functions within the software.
- Evolution: As requirements change, the boundary may shift. A feature that was external might become internal, or vice versa. The diagram should reflect the current scope.
A well-defined boundary helps developers understand where their code starts and ends. It also helps testers know what to validate. Without this box, the model becomes a collection of unrelated functions rather than a cohesive system.
Relationship Types Explained 🔗
Lines connecting the elements are not just decorative; they carry semantic meaning. There are three primary types of relationships used in standard modeling. Understanding the difference is crucial for accurate requirement specification.
| Relationship Type | Notation | Meaning | Example |
|---|---|---|---|
| Association | Solid Line | Communication between actor and use case | A Customer places an order |
| Include | Dashed Line with <<include>> | Mandatory behavior included in another use case | “Login” is included in “Update Profile” |
| Extend | Dashed Line with <<extend>> | Optional behavior that adds to a base use case | “Apply Coupon” extends “Checkout” |
| Generalization | Solid Line with Hollow Triangle | One actor or use case is a specialized version of another | “Admin” is a type of “User” |
The Association line is the most basic. It indicates that the actor participates in the use case. It does not imply directionality in a strict sense, but it shows a connection. If a line is missing, the actor cannot perform that function.
The Include relationship is used when a part of a use case is always required to complete the parent use case. For example, if every order requires authentication, the “Authenticate” use case is included in the “Place Order” use case. This promotes reuse and reduces duplication in the model.
The Extend relationship indicates optional behavior. The base use case functions without the extension, but under specific conditions, the extension may occur. This is useful for error handling or special promotions. It keeps the main flow clean while acknowledging exceptions.
The Process of Creating a Diagram 📝
Building a diagram is not a one-time task. It is part of a broader requirements engineering process. Following a structured approach ensures consistency and accuracy.
- 1. Gather Requirements: Collect user stories, interviews, and documentation. Understand the business goals before drawing anything.
- 2. Identify Actors: Determine who interacts with the system. List potential roles and group them.
- 3. Define Use Cases: Write down the goals. Ensure each use case has a clear start and end point.
- 4. Draw Relationships: Connect actors to use cases using associations. Add includes and extends where logic dictates.
- 5. Validate: Review the diagram with stakeholders. Ask if it matches their mental model of the system.
- 6. Iterate: Update the diagram as requirements evolve. Do not let the model become outdated.
Skipping steps often leads to gaps. For instance, defining use cases before identifying actors can result in functions with no owners. Always start with the “who” and the “what” before connecting the “how”.
Common Pitfalls to Avoid ⚠️
Even experienced modelers make mistakes. Recognizing common errors helps in maintaining high-quality diagrams. Below is a checklist of issues to watch for.
| Pitfall | Why it is a Problem | Correction |
|---|---|---|
| Too Many Actors | Makes the diagram cluttered and hard to read | Consolidate roles or remove inactive actors |
| Implementation Details | Shows how the system works, not what it does | Focus on goals, not technical steps |
| Missing System Boundary | Scope is unclear to the viewer | Always draw a clear rectangle around functions |
| Crossing Lines | Confuses the relationship connections | Use layout techniques to minimize intersections |
One frequent error is including technical implementation details. A diagram should remain technology-agnostic. Avoid mentioning databases, programming languages, or specific UI screens. If a requirement changes the technology stack, the diagram should remain valid. This longevity adds value to the documentation.
Another issue is the misuse of Include and Extend. If a behavior is mandatory, use Include. If it is optional or conditional, use Extend. Confusing these two leads to incorrect logic during development. Developers might implement optional features as required, or miss critical validations.
Connecting Diagrams to Textual Requirements 📄
A diagram alone is rarely sufficient. It works best when paired with detailed textual descriptions. The diagram provides the overview, while the text provides the detail.
- Traceability: Each use case on the diagram should link to a detailed requirement document. This ensures nothing is lost in translation.
- Preconditions: Textual specs should list what must be true before a use case starts. The diagram implies this, but the text confirms it.
- Postconditions: Define the state of the system after the use case completes. This helps in testing and validation.
- Exceptions: List error scenarios. The diagram shows the happy path, but the text covers the failures.
When stakeholders review the requirements, they can look at the diagram to get the big picture and read the text to understand the nuances. This dual approach reduces misinterpretation. It also aids in impact analysis. If a requirement changes, you can trace it from the text to the diagram and see which actors are affected.
Maintaining the Model Over Time 🔄
Requirements are not static. Business needs change, and features are added or removed. A static diagram becomes a liability if it does not evolve with the project.
- Version Control: Treat the diagram as code. Store it in a repository to track changes over time.
- Review Cycles: Schedule regular reviews of the diagram during sprint planning or phase gates.
- Update Triggers: Establish rules for when an update is mandatory. For example, any new major feature requires a diagram update.
- Documentation Hygiene: Remove obsolete use cases. Dead code in a diagram is as bad as dead code in software.
Maintaining the model requires discipline. It is easy to add new features to the diagram and forget to remove old ones. A clean diagram builds trust with the development team. If the model is accurate, developers are more likely to follow it. If it is outdated, they will ignore it.
Advanced Considerations for Complex Systems 🧠
For large enterprise systems, a single diagram may not suffice. Complexity requires hierarchy and organization.
- Package Diagrams: Group related use cases into packages to reduce visual noise. This creates a high-level view of the system architecture.
- Sub-System Diagrams: Break down large use cases into smaller diagrams. This allows for detail without cluttering the main view.
- Context Diagrams: Use a simplified diagram to show the system’s relationship with the outside world at a high level.
These techniques help manage cognitive load. Stakeholders can zoom in on the areas relevant to them. This modularity supports better communication across different teams. It also aids in modular development, where different teams work on different subsystems.
Final Thoughts on Visualization 🌟
Effective requirement visualization is a skill that improves with practice. It requires a balance between technical accuracy and business clarity. By focusing on actors, clear boundaries, and precise relationships, teams can create diagrams that serve as a reliable source of truth.
Remember that the diagram is a tool for communication, not just documentation. Its value lies in the discussions it sparks among stakeholders. When a diagram is clear, questions are answered faster, and decisions are made with confidence. Prioritize clarity over complexity, and ensure the model serves the people who build and use the system.
Adopting these practices leads to better aligned teams and more predictable project outcomes. The effort invested in modeling pays off during implementation and testing. A well-structured Use Case Diagram reduces ambiguity and supports the delivery of high-quality software solutions.