


Introduction
In today’s rapidly evolving software landscape, architecture documentation often falls into one of two traps: it’s either too abstract to be useful or so detailed that only a handful of developers can understand it. This communication gap between high-level architectural vision and implementation details creates friction during onboarding, slows down decision-making, and leads to architectural drift over time.
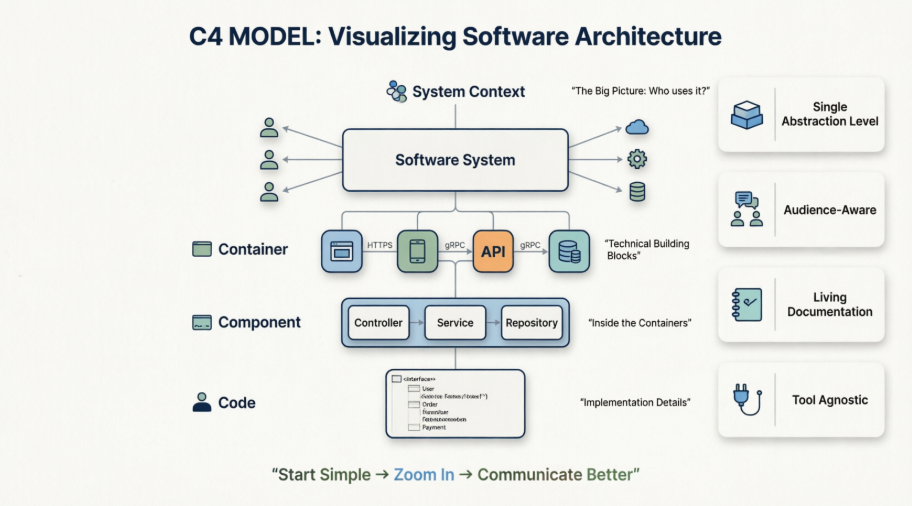
The C4 Model emerges as a pragmatic solution to this challenge. Developed by software architect Simon Brown, this hierarchical approach to software architecture visualization bridges the divide between stakeholder communication and technical implementation. By organizing architectural views into four distinct levels of abstraction—Context, Container, Component, and Code—the C4 Model enables teams to create living documentation that serves multiple audiences without overwhelming any single group.
This case study demonstrates the practical application of the C4 Model through the lens of a modern e-commerce platform. We’ll explore how each abstraction level serves different purposes, from executive stakeholder alignment to developer implementation guidance. Through detailed diagrams and real-world examples, you’ll see how the C4 Model transforms architectural documentation from a static artifact into a dynamic communication tool that evolves alongside your system.
Whether you’re a seasoned architect looking to improve team communication or a development team struggling with documentation debt, this case study provides actionable insights into creating architecture diagrams that people actually want to use and maintain.
Understanding the C4 Model Framework
The Four Levels of Abstraction
The C4 Model’s power lies in its hierarchical structure, which mirrors how we naturally understand complex systems—starting with the big picture and progressively zooming in on details. Think of it like navigating with Google Maps: you begin with a country-level view, zoom into a city, explore neighborhoods, and finally examine individual street addresses.
Level 1: System Context provides the 30,000-foot view, showing your software system as a single box in the center, surrounded by the people and external systems it interacts with. This diagram answers the fundamental question: “What is this system, and why does it exist?”
Level 2: Container zooms in to reveal the high-level technical building blocks—web applications, mobile apps, databases, and microservices. Here, we answer: “How is the system structured from a technical perspective?”
Level 3: Component dives deeper into individual containers, showing the major components within each. This level helps developers understand: “What are the key responsibilities within each deployment unit?”
Level 4: Code represents the implementation details—classes, interfaces, and data structures. This optional level answers: “How is this specific functionality implemented?”
Core Principles for Effective C4 Diagrams
The C4 Model succeeds because it adheres to several key principles that distinguish it from traditional modeling approaches:
Abstraction Discipline: Each diagram focuses on a single level of detail. Never mix containers and components in the same view, as this creates cognitive overload and confuses the audience.
Audience Awareness: Different stakeholders need different views. Executives and product owners typically need only Level 1, while developers working on specific features may need Levels 2 and 3. Level 4 is reserved for complex algorithms or critical design decisions.
Notation Flexibility: Unlike UML’s rigid symbolism, the C4 Model encourages teams to use whatever visual notation works for them—rectangles, colors, icons—as long as it’s consistent. The goal is communication, not compliance with a standard.
Living Documentation: C4 diagrams should evolve with the codebase. Outdated diagrams are worse than no diagrams at all, as they erode trust and create confusion.
Case Study: Modern E-Commerce Platform Architecture
System Overview
Our case study examines a contemporary e-commerce platform that enables online shoppers to discover products, manage shopping carts, and complete purchases while providing store managers with inventory management and analytics capabilities. The platform integrates with third-party payment processing (Stripe) and shipping logistics (FedEx) to deliver a complete commerce experience.
The architecture follows modern microservices principles, utilizing a GraphQL API gateway for client communication, event-driven architecture for inter-service messaging, and polyglot persistence strategies optimized for different data access patterns.
Level 1: System Context Diagram — The Big Picture
Purpose and Stakeholder Value
The System Context diagram serves as the architectural north star, providing a shared understanding of the system’s boundaries and external dependencies. This view is essential for:
-
Executive stakeholders who need to understand system scope and integration points
-
Product managers defining roadmap and feature boundaries
-
New team members getting oriented with the ecosystem
-
Security teams identifying trust boundaries and external attack surfaces
What to Include
The context diagram for our e-commerce platform reveals four critical external actors and systems:
-
Online Shopper: The primary customer persona who browses products, adds items to cart, and completes checkout
-
Store Manager: Internal user responsible for catalog management, pricing updates, and sales analytics
-
Stripe API: External payment gateway handling secure credit card processing
-
FedEx Shipping API: Third-party logistics integration for real-time shipping rates and tracking
Key Design Decisions
Notice what’s deliberately excluded: there are no databases, no microservices, no technology stacks. This diagram answers “what” and “who,” not “how.” The relationships use plain language (“Discovers products and buys goods”) rather than technical protocols, making it accessible to non-technical stakeholders.
System Context Diagram
@startuml
!include https://raw.githubusercontent.com/plantuml-stdlib/C4-PlantUML/master/C4_Container.puml

LAYOUT_WITH_LEGEND()

title System Context Diagram for E-Commerce Platform

Person(customer, "Online Shopper", "Browses products, adds items to cart, and completes checkout.")
Person(manager, "Store Manager", "Manages product catalog, prices, and views sales analytics.")

System(ecommerce, "E-Commerce Platform", "Handles product discovery, shopping carts, order orchestration, and secure customer billing.")

System_Ext(stripe, "Stripe API", "Third-party payment gateway that securely processes credit card transactions.")
System_Ext(fedex, "FedEx Shipping API", "Calculates real-time freight shipping rates and generates tracking labels.")

Rel(customer, ecommerce, "Discovers products and buys goods using", "HTTPS")
Rel(manager, ecommerce, "Updates inventory and reviews metrics using", "HTTPS")

Rel(ecommerce, stripe, "Authorizes and captures charges via", "REST/JSON")
Rel(ecommerce, fedex, "Schedules deliveries and tracks shipments via", "REST/JSON")
@enduml
Common Pitfalls to Avoid
Many teams struggle with Level 1 diagrams by:
-
Adding too much detail: Including databases or internal services belongs in Level 2
-
Using vague actor names: “User” is less helpful than “Registered Customer” or “Guest Shopper”
-
Missing critical dependencies: Forgetting external integrations creates architectural blind spots
-
Technical relationship labels: “HTTP POST /orders” should be “Places order” for this audience
Level 2: Container Diagram — High-Level Technical Architecture
Bridging Context and Implementation
The Container diagram zooms into the “E-Commerce Platform” box from Level 1, revealing the major deployable units that comprise the system. In C4 terminology, a “container” is not a Docker container but rather a separately deployable unit that executes code or stores data—think web applications, mobile apps, server-side services, and databases.
Architectural Components Revealed
Our e-commerce platform’s container architecture consists of:
Frontend Layer:
-
Web Frontend (Next.js/React): A server-side rendered React application providing responsive UI, SEO optimization, and client-side interactivity
Integration Layer:
-
API Gateway (Apollo GraphQL): A unified query layer that aggregates downstream services, handles request routing, and provides schema stitching
Service Layer:
-
Catalog Service (Go/Gin): Manages product information, inventory status, pricing rules, and product variations using a high-performance Go microservice
-
Order Service (Java/Spring Boot): Orchestrates shopping cart operations, order state management, and payment workflow coordination
Data Layer:
-
Catalog DB (MongoDB): Document database optimized for flexible product schemas with dynamic attributes
-
Order DB (PostgreSQL): Relational database ensuring ACID compliance for transactional order data
Infrastructure:
-
Event Bus (Apache Kafka): Asynchronous messaging backbone enabling event-driven communication between services
Technology Rationale
The polyglot architecture reflects deliberate technology choices:
-
Next.js for frontend provides server-side rendering crucial for SEO in e-commerce
-
GraphQL at the gateway prevents over-fetching and under-fetching common in REST APIs
-
Go for catalog service leverages its performance advantages for read-heavy product queries
-
Spring Boot for order service benefits from mature transaction management and ecosystem
-
MongoDB accommodates varying product attributes across categories
-
PostgreSQL ensures data integrity for financial transactions
Container Diagram
@startuml
!include https://raw.githubusercontent.com/plantuml-stdlib/C4-PlantUML/master/C4_Container.puml

LAYOUT_WITH_LEGEND()

title Container Diagram for E-Commerce Platform

Person(customer, "Online Shopper", "Browses products, adds items to cart, and completes checkout.")
System_Ext(stripe, "Stripe API", "Processes payments securely.")

System_Boundary(platform, "E-Commerce Platform") {
    Container(frontend, "Web Frontend", "Next.js / React", "Serves the responsive web layout and optimizes SEO catalog pages.")
    Container(gateway, "API Gateway", "Apollo GraphQL", "Aggregates, routes, and validates downstream microservice queries.")

    Container(catalogService, "Catalog Service", "Go / Gin", "Manages product inventory status, variations, and active pricing rules.")
    ContainerDb(catalogDb, "Catalog DB", "MongoDB", "Document store optimized for highly dynamic product attributes.")

    Container(orderService, "Order Service", "Java / Spring Boot", "Orchestrates shopping carts, updates order state, and triggers billing.")
    ContainerDb(orderDb, "Order DB", "PostgreSQL", "Relational database maintaining transactional integrity for customer orders.")

    Container(messageBus, "Event Bus", "Apache Kafka", "Handles asynchronous messaging and domain events between services.")
}

Rel(customer, frontend, "Interacts with", "HTTPS")
Rel(frontend, gateway, "Queries and mutates data through", "GraphQL/HTTPS")

Rel(gateway, catalogService, "Routes catalog requests to", "gRPC")
Rel(gateway, orderService, "Routes checkout requests to", "gRPC")

Rel(catalogService, catalogDb, "Reads/Writes data", "Mongo Driver")
Rel(orderService, orderDb, "Reads/Writes data", "JDBC")

Rel(orderService, messageBus, "Publishes 'OrderPlaced' events to")
Rel_Back(catalogService, messageBus, "Listens for stock reservation events on")

Rel(orderService, stripe, "Invokes remote payment processing", "HTTPS/REST")
@enduml
Communication Patterns
The diagram reveals critical architectural decisions about service communication:
-
Synchronous gRPC between gateway and services ensures low-latency request/response for user-facing operations
-
Asynchronous Kafka messaging between Order and Catalog services enables loose coupling and eventual consistency for inventory updates
-
Direct HTTPS to Stripe keeps payment processing synchronous for immediate confirmation
Deployment vs. Logical Containers
It’s crucial to understand that these logical containers may deploy differently in production:
-
The “Order Service” container might run as 10 Kubernetes pods behind a load balancer
-
“PostgreSQL” could be an Amazon RDS instance with read replicas
-
“Kafka” might be a Confluent Cloud cluster with multiple brokers
Level 2 focuses on what runs, not where it runs—deployment topology belongs in separate infrastructure diagrams.
Level 3: Component Diagram — Inside the Order Service
When to Create Component Diagrams
Level 3 diagrams aren’t necessary for every container. Create them when:
-
Onboarding developers to complex business logic
-
Planning refactoring or modularization efforts
-
Documenting public APIs or extension points
-
Conducting threat modeling or security reviews
-
Clarifying responsibilities in large containers
Skip Level 3 when containers are simple (<5 logical components) or when the team has strong shared understanding.
Component Boundaries and Responsibilities
Our Order Service component diagram reveals the internal structure of this critical business capability:
Order Controller (Spring REST/gRPC Endpoint): The entry point exposing API operations for cart management and checkout execution. This component handles protocol translation, request validation, and response formatting.
Checkout Processor (Spring Bean): The brain of the order service, orchestrating the complex workflow of item validation, inventory reservation, payment processing, and order confirmation. This component embodies the core business logic.
Payment Integration Client (HTTP Service Wrapper): An anti-corruption layer that translates internal order metadata into Stripe’s API requirements, handling authentication, error mapping, and retry logic.
Event Dispatcher (Kafka Template Bean): Publishes domain events like “OrderPlaced,” “OrderPaid,” and “OrderShipped” to keep downstream systems (analytics, notifications, fulfillment) synchronized.
Order Repository (Spring Data JPA): Abstracts database interactions, providing a clean interface for persisting and retrieving order aggregates while hiding SQL complexity.
Dependency Flow
The component diagram illustrates a clear dependency hierarchy:
-
API Gateway invokes the Order Controller via gRPC
-
Controller delegates to Checkout Processor for business logic
-
Processor coordinates multiple downstream operations:
-
Saves initial order state via Order Repository
-
Requests payment through Payment Integration Client
-
Triggers event publication via Event Dispatcher
-
-
Repository persists to PostgreSQL using JDBC
-
Payment Client communicates with Stripe API over HTTPS
-
Event Dispatcher publishes to Kafka message bus
Component Diagram
@startuml
!include https://raw.githubusercontent.com/plantuml-stdlib/C4-PlantUML/master/C4_Component.puml

LAYOUT_WITH_LEGEND()

title Component Diagram for Order Service Container

Container(gateway, "API Gateway", "Apollo GraphQL", "Routes incoming user transactions.")
ContainerDb(orderDb, "Order DB", "PostgreSQL", "Maintains high-integrity transactional status.")
Container(messageBus, "Event Bus", "Apache Kafka", "Broadcasting platform messages.")
System_Ext(stripe, "Stripe API", "External payment provider.")

Container_Boundary(order_service_boundary, "Order Service") {
    Component(graphqlResolver, "Order Controller", "Spring REST/gRPC Endpoint", "Exposes API targets for cart operations and checkout execution.")
    Component(checkoutOrchestrator, "Checkout Processor", "Spring Bean", "Executes business workflow steps for item validation, reservation, and capture.")
    Component(paymentClient, "Payment Integration Client", "HTTP Service Wrapper", "Translates order metadata into payload structural requirements for Stripe.")
    Component(kafkaProducer, "Event Dispatcher", "Kafka Template Bean", "Publishes domain events to keep peripheral systems synchronized.")
    Component(orderRepo, "Order Repository", "Spring Data JPA", "Abstracts data read/write interactions away from concrete tables.")

    Rel(gateway, graphqlResolver, "Invokes checkout endpoints", "gRPC")

    Rel(graphqlResolver, checkoutOrchestrator, "Delegates requests to")
    Rel(checkoutOrchestrator, orderRepo, "Saves initial order state via")
    Rel(checkoutOrchestrator, paymentClient, "Requests payment processing from")
    Rel(checkoutOrchestrator, kafkaProducer, "Triggers event generation through")

    Rel(orderRepo, orderDb, "Saves entities to", "JDBC")
    Rel(paymentClient, stripe, "Processes transaction on", "HTTPS/JSON")
    Rel(kafkaProducer, messageBus, "Publishes 'OrderPaid' event stream", "TCP")
}
@enduml
Design Principles in Action
This component structure demonstrates several architectural best practices:
Separation of Concerns: Each component has a single, well-defined responsibility. The controller handles protocol concerns, the processor handles business logic, and the repository handles persistence.
Dependency Inversion: The Checkout Processor depends on abstractions (interfaces) rather than concrete implementations, enabling easier testing and component replacement.
Anti-Corruption Layer: The Payment Integration Client shields the domain model from external API concerns, preventing Stripe’s data structures from leaking into core business logic.
Event-Driven Architecture: The Event Dispatcher enables loose coupling between order processing and downstream consumers, allowing the system to evolve independently.
Naming Conventions Matter
Notice the specific, intention-revealing names: “Checkout Processor” instead of “OrderHelper,” “Payment Integration Client” instead of “StripeService.” Good component names communicate purpose without requiring additional documentation.
Level 4: Code Diagram — Implementation Details
When Code-Level Diagrams Add Value
Level 4 diagrams are optional and situational. In our experience, they’re most valuable for:
-
Complex algorithms or design patterns that aren’t obvious from code alone
-
Critical domain logic where correctness is paramount (payment processing, compliance rules)
-
Knowledge transfer during team transitions or onboarding
-
Architecture decision records documenting why a particular implementation was chosen
For most day-to-day development, well-structured code with comprehensive tests and inline documentation suffices. Modern IDEs provide excellent code navigation, making static class diagrams less necessary than they were decades ago.
Domain-Driven Design Implementation
Our Level 4 diagram focuses on the Checkout Processor’s implementation, revealing domain-driven design patterns:
ICheckoutProcessor Interface: Defines the contract for order processing, enabling dependency injection and testability. The interface abstracts the complexity of the checkout workflow behind a simple processCheckout method.
CheckoutProcessor Implementation: The concrete class orchestrating the checkout workflow. It coordinates between repositories, payment clients, and domain entities to execute the business process.
OrderAggregate: A rich domain entity encapsulating order business rules. Notice methods like transitionToPaid() and transitionToFailed()—these enforce valid state transitions and prevent invalid order states.
Money Value Object: A primitive obsession antidote, this value object encapsulates monetary amounts with currency awareness, preventing bugs from currency mismatches or floating-point arithmetic.
Repository and Client Interfaces: IOrderRepository and IPaymentClient define ports for persistence and external service integration, following the hexagonal architecture pattern.
Code Diagram
@startuml
title Code Diagram for Checkout Processor Implementation

interface ICheckoutProcessor {
    +processCheckout(cart: ShoppingCart): OrderConfirmation
}

class CheckoutProcessor {
    -orderRepository: IOrderRepository
    -paymentClient: IPaymentClient
    +processCheckout(cart: ShoppingCart): OrderConfirmation
    -calculateTotal(items: List<CartItem>): Money
}

interface IOrderRepository {
    +saveOrder(order: OrderAggregate): OrderId
    +findOrderById(id: OrderId): OrderAggregate
}

interface IPaymentClient {
    +executeCharge(amount: Money, token: String): PaymentResult
}

class OrderAggregate {
    -orderId: OrderId
    -lineItems: List<OrderLineItem>
    -status: OrderStatus
    +transitionToPaid()
    +transitionToFailed()
}

class Money {
    -amount: BigDecimal
    -currency: String
}

ICheckoutProcessor <|-- CheckoutProcessor
CheckoutProcessor --> IOrderRepository : persists via
CheckoutProcessor --> IPaymentClient : charges via
CheckoutProcessor ..> OrderAggregate : orchestrates
OrderAggregate *-- Money : uses
@enduml
Implementation Patterns Revealed
The diagram illustrates several critical implementation decisions:
Dependency Injection: CheckoutProcessor receives its dependencies (IOrderRepository, IPaymentClient) through constructor injection, enabling unit testing with mocks and supporting the Single Responsibility Principle.
Domain-Driven Aggregates: OrderAggregate is a consistency boundary, ensuring that order state changes are atomic and valid. The aggregate root controls access to child entities (OrderLineItem).
Value Objects over Primitives: Money encapsulates both amount and currency, preventing the common e-commerce bug of adding USD to EUR. Using BigDecimal avoids floating-point rounding errors in financial calculations.
Interface Segregation: Separate interfaces for repository and payment client allow the CheckoutProcessor to depend only on the methods it actually uses, rather than bulky service classes.
Alternatives to Full Code Diagrams
For most teams, these alternatives provide better ROI than maintaining Level 4 diagrams:
-
Auto-generated API documentation (Swagger/OpenAPI) for service contracts
-
Entity-Relationship Diagrams generated from database schemas
-
Sequence diagrams for critical runtime flows (created on-demand, not maintained)
-
Architecture Decision Records (ADRs) documenting why key design choices were made
-
Living code documentation through well-named classes, methods, and comprehensive tests
Supporting Architectural Views
Dynamic/Runtime Diagrams
While the C4 Model’s core levels show static structure, understanding runtime behavior is equally important. Dynamic diagrams answer: “What happens when a customer clicks ‘Checkout’?”
For our e-commerce platform, a critical runtime sequence might show:
-
Customer submits checkout request through Web Frontend
-
Frontend sends GraphQL mutation to API Gateway
-
Gateway routes to Order Service’s Checkout Processor
-
Processor validates cart items against Catalog Service
-
Processor reserves inventory via Kafka event
-
Processor invokes Stripe payment processing
-
On payment success, Processor publishes OrderPlaced event
-
Catalog Service listens for event and decrements inventory
-
Notification Service sends confirmation email
-
Response flows back through the chain to customer
These sequence diagrams are best created sparingly for complex or critical workflows, not for every use case.
Deployment Diagrams
DevOps and infrastructure teams need deployment views that map logical containers to physical infrastructure:
-
Web Frontend: Deployed to Vercel edge network with global CDN
-
API Gateway: Kubernetes deployment with horizontal pod autoscaling
-
Order Service: Kubernetes stateful set with pod anti-affinity rules
-
PostgreSQL: Amazon RDS with multi-AZ deployment and read replicas
-
Kafka: Confluent Cloud cluster with 3 brokers across availability zones
-
MongoDB: MongoDB Atlas with sharded cluster for horizontal scaling
Deployment diagrams should include network topology, security groups, load balancers, and disaster recovery configurations—details intentionally excluded from Level 2 container diagrams.
System Landscape Diagram
At the enterprise level, a System Landscape diagram shows how the E-Commerce Platform fits into the broader organizational ecosystem:
-
CRM System (Salesforce): Customer data synchronization
-
ERP System (SAP): Financial reconciliation and inventory planning
-
Data Warehouse (Snowflake): Analytics and business intelligence
-
Customer Support Portal (Zendesk): Ticket integration for order issues
-
Marketing Automation (HubSpot): Campaign triggering based on purchase behavior
This view is essential for enterprise architects managing integration roadmaps and identifying technical debt across the portfolio.
Practical Implementation Guide
Getting Started with C4 in Your Team
Week 1: Run a Workshop
Gather your team for a 90-minute collaborative session. Pick one system (ideally not the most complex one) and collaboratively draft a Level 1 diagram on a whiteboard or using Visual Paradigm. Focus on achieving consensus about system boundaries and external dependencies.
Week 2-3: Create Level 2
Assign a small team (2-3 people) to develop the Container diagram. Use this as an opportunity to document technology decisions and identify architectural inconsistencies. Review with the broader team for validation.
Week 4: Selective Level 3
Create Component diagrams only for complex or critical containers. Don’t boil the ocean—start with the 20% of containers that cause 80% of confusion.
Ongoing: Maintain as Living Documentation
Integrate diagram updates into your development workflow:
-
Update diagrams as part of feature implementation (not after)
-
Review diagrams during architecture decision records
-
Reference diagrams in pull requests for complex changes
-
Archive outdated diagrams with clear deprecation notices
Tool Selection Strategy
Visual Paradigm Desktop: Best for teams wanting comprehensive diagramming capabilities with C4-specific templates and collaboration features.
Visual Paradigm Online: Ideal for distributed teams needing browser-based access without desktop installation.
Structurizr: Perfect for teams wanting “diagrams as code” with version control integration and automated validation.
PlantUML: Great for developers who prefer text-based diagram definitions that live alongside source code.
Draw.io / Diagrams.net: Good for teams starting out with free, simple tooling before investing in specialized solutions.
The best tool is the one your team will actually use consistently.
Integration with Agile Processes
Sprint Planning: Reference Level 2/3 diagrams when estimating complex stories. Understanding which containers and components are affected improves estimation accuracy.
Backlog Refinement: Use Context diagrams to clarify scope and external dependencies when grooming epics.
Retrospectives: Update diagrams if architecture evolved unexpectedly during the sprint. Treat diagram drift as technical debt.
Onboarding: New hires review Level 1-2 diagrams in their first week as part of orientation. Assign a mentor to walk through the diagrams.
Architecture Reviews: Use C4 diagrams as the foundation for design discussions, ensuring everyone shares the same mental model.
Ownership and Governance
Level 1 (Context): Owned jointly by Product Manager and Tech Lead. Updated when external integrations change or new user personas emerge.
Level 2 (Container): Owned by System Architect or Senior Engineer. Updated when adding/removing services, databases, or major infrastructure components.
Level 3 (Component): Owned by feature team leads or component owners. Updated when refactoring internal structure or adding significant new components.
Level 4 (Code): Owned by individual developers as needed. Created for complex algorithms or critical domain logic, often as part of architecture decision records.
Golden Rule: The team that builds the system should maintain its diagrams. Avoid assigning documentation to people who don’t understand the architecture.
Common Challenges and Solutions
Challenge 1: Diagrams Become Outdated
Symptom: Developers complain diagrams don’t match the codebase, leading to distrust and abandonment.
Solution:
-
Integrate diagram updates into the definition of done
-
Assign diagram ownership alongside code ownership
-
Use automated tools (Structurizr, PlantUML) that generate diagrams from code where possible
-
Schedule quarterly diagram audits during architecture reviews
-
Version control diagrams alongside code in the same repository
Challenge 2: Too Much Detail, Too Soon
Symptom: Level 1 diagrams include databases and microservices, overwhelming non-technical stakeholders.
Solution:
-
Enforce abstraction discipline through peer review
-
Create separate diagrams for different audiences (executive summary vs. technical deep-dive)
-
Use the “5-second rule”: Can someone grasp the diagram’s purpose in 5 seconds?
-
Start with minimal diagrams and add detail only when questions arise
Challenge 3: Tool Friction
Symptom: Team avoids updating diagrams because the tool is cumbersome or requires special skills.
Solution:
-
Choose the simplest tool that meets your needs
-
Prefer text-based diagram definitions (PlantUML, Structurizr DSL) for developer-friendly workflows
-
Provide templates and examples to reduce cognitive load
-
Integrate diagram generation into CI/CD pipelines
-
Offer brief training sessions on tool usage
Challenge 4: Mixing Abstraction Levels
Symptom: Diagrams show both containers and components, creating confusion about scope.
Solution:
-
Establish clear diagram naming conventions (e.g., “E-Commerce Platform – Context”, “E-Commerce Platform – Containers”)
-
Use diagram boundaries/frames to enforce scope
-
Review diagrams with fresh eyes: “If I knew nothing about this system, would this diagram make sense?”
-
Link diagrams hierarchically (Context → Container → Component) rather than combining them
Challenge 5: Lack of Stakeholder Buy-In
Symptom: Leadership sees diagrams as overhead without clear value.
Solution:
-
Start with a single, high-impact diagram (usually Level 1 Context)
-
Demonstrate value through faster onboarding or clearer decision-making
-
Quantify benefits: “New hire ramp-up time reduced from 3 weeks to 1 week”
-
Share success stories from other teams or organizations
-
Make diagrams visible: Post them in team spaces, reference them in meetings
Measuring Success
Qualitative Indicators
Improved Communication: Stakeholders reference diagrams in discussions, reducing misunderstandings about system boundaries and responsibilities.
Faster Onboarding: New team members report feeling oriented more quickly, asking fewer basic architecture questions.
Better Decision-Making: Architecture reviews surface risks and trade-offs earlier, reducing costly rework.
Increased Confidence: Developers feel more confident making changes, understanding the impact across containers and components.
Quantitative Metrics
Onboarding Time: Track time from hire to first production deployment. Target: 30-50% reduction.
Architecture Review Duration: Measure time spent explaining current state vs. discussing proposals. Target: 40% less time on current state explanation.
Diagram Freshness: Percentage of diagrams updated in the last sprint. Target: >80% currency.
Documentation Satisfaction: Survey team members quarterly on documentation usefulness. Target: >4/5 average rating.
Production Incidents: Track incidents caused by misunderstanding system boundaries or dependencies. Target: Downward trend.
Conclusion
The C4 Model transforms software architecture documentation from a static, often-neglected artifact into a dynamic communication tool that serves multiple audiences across the organization. Through our e-commerce platform case study, we’ve demonstrated how each level of abstraction—from System Context to Code—addresses specific stakeholder needs while maintaining a coherent hierarchical structure.
The key insight is that architecture diagrams aren’t about creating perfect representations of your system. They’re about facilitating better conversations, faster decision-making, and clearer shared understanding. A simple Context diagram created on a whiteboard during a 90-minute workshop delivers more value than a comprehensive UML model that takes months to complete and nobody reads.
Success with the C4 Model requires discipline: resisting the urge to mix abstraction levels, maintaining diagrams as living documentation, and choosing the simplest tools that enable collaboration. But the rewards are substantial: reduced onboarding time, clearer architecture reviews, better risk identification, and a common visual language that bridges the gap between technical and non-technical stakeholders.
Start small. Create one Context diagram this week. Share it with your team. Iterate based on feedback. That’s the C4 Model in action—not a certification or a methodology, but a practical approach to communicating about software architecture that actually works.
Your architecture is too important to live only in people’s heads. Make it visible. Make it understandable. Make it living. The C4 Model provides the framework; your team provides the commitment. Together, they create documentation that people actually want to use.
References
-
C4 Diagram Tool & Modeling Software | Visual Paradigm: Comprehensive overview of Visual Paradigm’s dedicated C4 modeling capabilities, including templates, symbols, and integration features for software architecture documentation.
-
AI Diagram Generator: Complete C4 Model Support | Visual Paradigm Updates: Release announcement detailing how Visual Paradigm’s AI tools now support end-to-end C4 model generation across all abstraction levels.
-
AI Diagram Generator Release Notes | Visual Paradigm: Technical documentation and feature highlights for the AI-powered diagram generation engine integrated into Visual Paradigm.
-
AI-Powered C4 PlantUML Studio | Visual Paradigm AI: Specialized tool description for converting natural language requirements into version-controllable PlantUML code for C4 diagrams.
-
Visual Paradigm AI Platform: Central hub for Visual Paradigm’s suite of AI-assisted modeling, diagramming, and documentation tools.
-
AI Chatbot for Diagram Generation | Visual Paradigm: Overview of the conversational AI interface that allows users to create and refine diagrams using natural language commands.
-
AI-Powered C4 PlantUML Markdown Editor | Visual Paradigm Updates: Feature release introducing markdown-based editing workflows for C4 diagrams with AI assistance.
-
AI Chatbot Tool | Visual Paradigm AI: Dedicated page for the AI chatbot interface used for interactive diagram creation and refinement.
-
Use Case to Activity Diagram Feature | Visual Paradigm: Documentation of Visual Paradigm’s feature for transforming use case models into activity diagrams, supporting broader architectural workflows.
-
C4 Model Tool in Visual Paradigm Online: Browser-based C4 modeling capabilities including real-time collaboration, symbol libraries, and cloud synchronization.
-
C4 Diagram Solution | Visual Paradigm: Enterprise-focused solution page highlighting how Visual Paradigm’s C4 tools support large-scale architecture initiatives.
-
What is C4 Model? | Visual Paradigm Blog: Educational blog post explaining the fundamentals, benefits, and practical applications of the C4 modeling methodology.