In the complex landscape of Enterprise Architecture (EA), intuition alone is insufficient. Organizations require tangible evidence to validate architectural decisions, ensure adherence to standards, and demonstrate value realization. Establishing metrics for architecture performance and compliance transforms abstract governance into measurable outcomes. This guide explores the methodologies required to define, measure, and manage architectural effectiveness within the context of the TOGAF framework.
1. The Strategic Necessity of Architecture Metrics 🎯
Without measurement, improvement remains a theoretical concept. Architecture metrics serve as the diagnostic tools for the health of an organization’s IT landscape. They bridge the gap between strategic intent and operational reality. When architects fail to define clear indicators, governance becomes subjective, and investment decisions lack a factual basis.
The primary objectives of establishing these metrics include:
- Validation of Value: Proving that architectural initiatives contribute to business goals.
- Risk Reduction: Identifying non-compliance or technical debt before they become critical failures.
- Resource Optimization: Directing budget and effort toward high-impact areas.
- Stakeholder Confidence: Providing transparent data to leadership and investors.
Effective metrics must be actionable. A number that cannot be influenced by the architecture team is merely a statistic, not a metric. Therefore, the selection process requires rigorous scrutiny of relevance and measurability.
2. Aligning with the TOGAF Framework 🏛️
The TOGAF standard provides a robust foundation for managing architecture metrics, particularly within the Architecture Governance and Architecture Development Method (ADM) phases. Integrating metrics into this lifecycle ensures consistency and repeatability.
Architecture Governance:
Within the Architecture Governance phase, metrics monitor the implementation of the architecture. This involves checking if the deployed solutions align with the approved Architecture Vision. Governance metrics focus on adherence to policies, standards, and constraints.
Architecture Development Method (ADM):
Each phase of the ADM cycle offers opportunities to define specific checkpoints. For instance:
- Phase A (Vision): Define the scope and identify key stakeholders.
- Phase B (Business): Measure business capability maturity.
- Phase C (Information Systems): Assess data and application integration.
- Phase D (Technology): Evaluate infrastructure scalability and security.
By embedding metrics into these phases, organizations create a continuous feedback loop. This loop allows for adjustments before the architecture is finalized, reducing rework and ensuring alignment with business needs.
3. Categorizing Performance Indicators 📈
Performance metrics differ from compliance metrics. While compliance focuses on adherence, performance focuses on efficiency, effectiveness, and value. A comprehensive strategy requires a balanced scorecard approach.
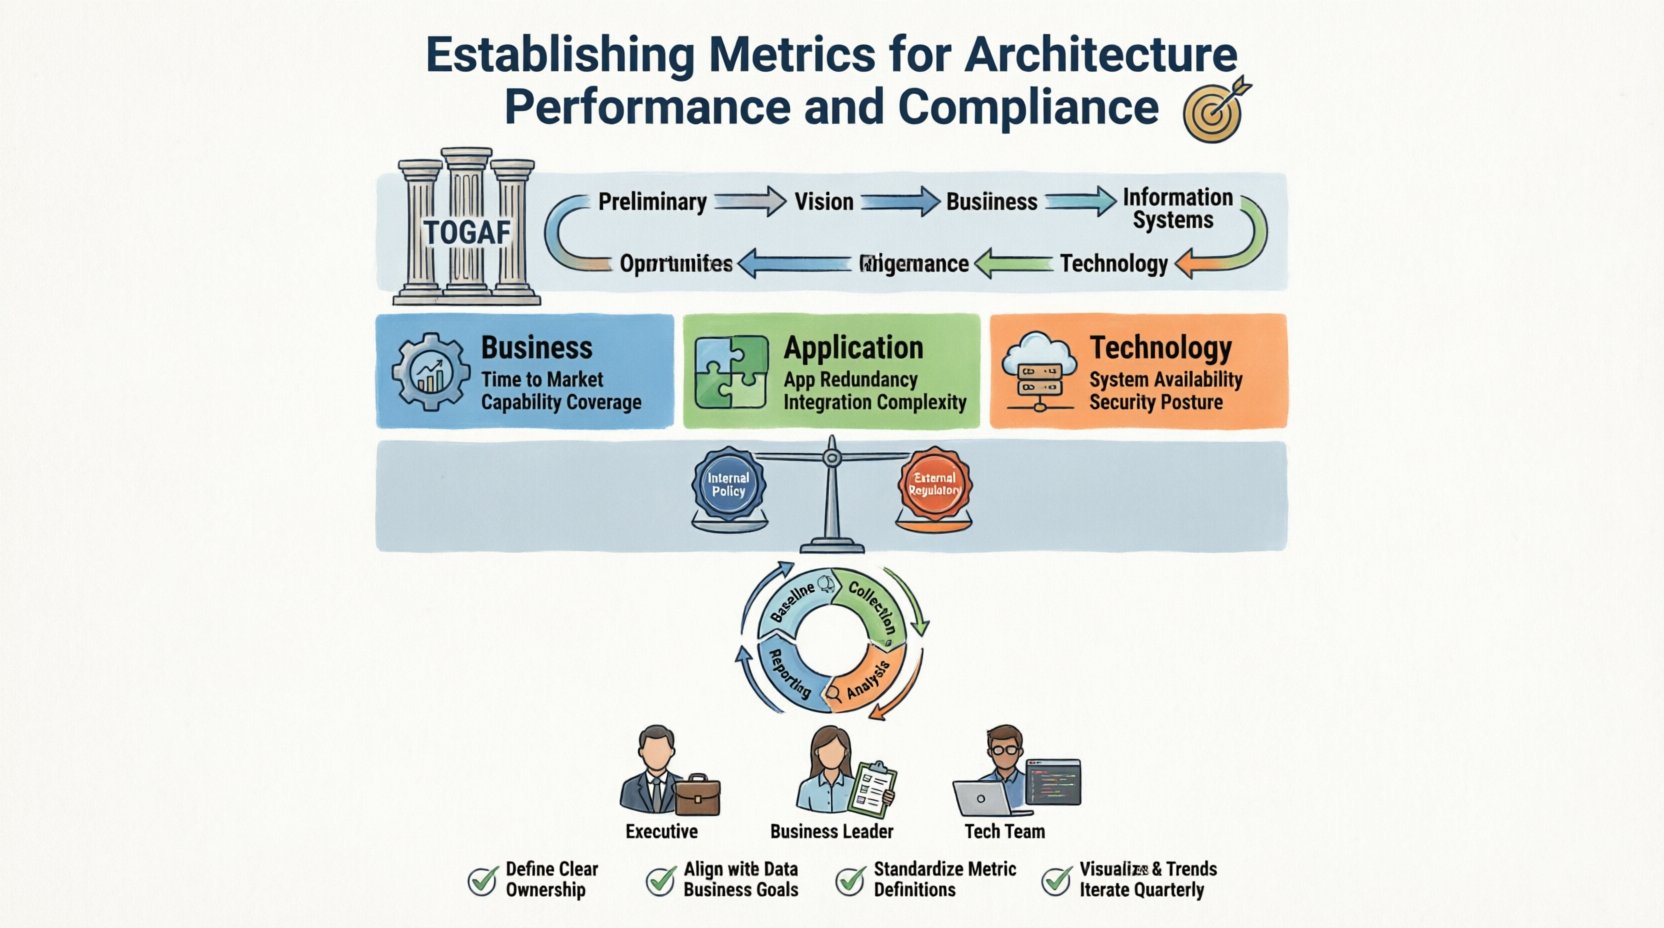
3.1 Business Architecture Metrics
These indicators measure how well the architecture supports business operations and strategy.
- Business Capability Coverage: The percentage of required business capabilities supported by the current architecture.
- Time to Market: The duration required to deploy a new business capability.
- Process Efficiency: The reduction in cycle time for core business processes due to architectural changes.
3.2 Application Architecture Metrics
These indicators assess the health and utility of the software landscape.
- Application Redundancy: The number of applications performing identical functions.
- Integration Complexity: The number of point-to-point interfaces versus the number of integrated services.
- Technology Obsolescence: The percentage of applications running on unsupported platforms.
3.3 Technology Architecture Metrics
These indicators focus on the infrastructure and technical foundation.
- System Availability: Uptime percentages for critical systems.
- Resource Utilization: CPU, memory, and storage usage efficiency.
- Security Posture: The number of identified vulnerabilities and their resolution time.
| Metric Category | Primary Focus | Example Indicator |
|---|---|---|
| Business | Value Realization | Capability Maturity Score |
| Application | Agility & Integration | API Coverage Ratio |
| Technology | Stability & Cost | Infrastructure Cost per Transaction |
4. Defining Compliance Standards and Controls ⚖️
Compliance metrics ensure that the architecture adheres to internal policies and external regulations. This area is critical for risk management and audit readiness.
4.1 Internal Policy Compliance
Organizations establish internal standards for technology selection, data security, and naming conventions. Compliance metrics track adherence to these rules.
- Standards Adherence Rate: Percentage of solutions compliant with the approved technology stack.
- Design Review Pass Rate: Percentage of architecture designs approved on the first review.
- Deviation Management: The number of active waivers and their expiration dates.
4.2 External Regulatory Compliance
External requirements often dictate specific architectural controls. Metrics in this area help demonstrate regulatory fitness.
- Data Sovereignty: Verification that data resides in approved geographic regions.
- Retention Policies: Adherence to data retention and disposal schedules.
- Access Controls: Frequency of access reviews and permission audits.
It is vital to distinguish between mandatory compliance and best practices. Mandatory compliance is non-negotiable, while best practices are aspirational. Metrics should reflect this distinction to prioritize remediation efforts.
5. Implementing the Measurement Lifecycle 🔁
Establishing metrics is not a one-time event. It requires a continuous lifecycle of definition, collection, analysis, and improvement.
5.1 Baseline Establishment
Before measuring change, you must measure the current state. A baseline provides the reference point for future comparisons. This involves inventorying assets, mapping capabilities, and assessing current risk levels.
5.2 Data Collection Strategy
Reliable metrics depend on reliable data. Automated collection methods are preferred over manual reporting to reduce error and latency. Data should flow from operational systems into a central repository for analysis.
- Automated Discovery: Scanning tools to identify assets.
- Integration Logs: Data from integration platforms regarding traffic and errors.
- Survey Data: Qualitative feedback from developers and users regarding usability.
5.3 Analysis and Interpretation
Data alone does not provide insight. Analysts must interpret the numbers in the context of business goals. A spike in technical debt might be acceptable if it accelerates a critical feature release, but it may be unacceptable during a stability phase.
5.4 Reporting and Visualization
Reports must be tailored to the audience. Executives require high-level summaries, while technical teams need granular details. Visualization tools help identify trends over time.
- Dashboards: Real-time views of key performance indicators.
- Periodic Reports: Monthly or quarterly deep dives into specific domains.
- Exception Reports: Alerts triggered when metrics fall outside acceptable thresholds.
| Stage | Key Activity | Output |
|---|---|---|
| Baseline | Asset Inventory | Current State Model |
| Collection | Data Aggregation | Raw Data Repository |
| Analysis | Trend Identification | Insight Report |
| Reporting | Stakeholder Communication | Executive Summary |
6. Reporting and Stakeholder Communication 🗣️
The value of metrics is lost if they are not communicated effectively. Different stakeholders require different information to make decisions.
6.1 For the Executive Board
Focus on strategic alignment and financial impact. Use terms like ROI, risk exposure, and strategic capability coverage. Avoid technical jargon.
- High-level compliance status.
- Investment efficiency.
- Major risks and mitigation status.
6.2 For Business Leaders
Focus on business outcomes and agility. Show how architecture enables or hinders business initiatives.
- Time to market for new products.
- Customer experience impact.
- Operational cost trends.
6.3 For Technical Teams
Focus on technical debt, stability, and standards adherence. Provide actionable data for remediation.
- System availability statistics.
- Code quality and dependency health.
- Security vulnerability counts.
7. Addressing Common Measurement Challenges 🛑
Implementing a metrics program often encounters resistance or technical hurdles. Recognizing these challenges early allows for proactive management.
7.1 Data Quality Issues
Garbage in, garbage out. If the underlying data is inaccurate, the metrics will mislead. Establish data governance protocols to ensure integrity.
7.2 Metric Fatigue
Tracking too many metrics dilutes focus. Teams may ignore dashboards if they are overwhelmed by data. Limit the number of primary KPIs to a manageable set.
7.3 Lack of Ownership
Metrics require owners. If no one is responsible for improving a metric, it will stagnate. Assign clear ownership for each key indicator.
7.4 Static vs. Dynamic Measurement
Architecture is dynamic. Static snapshots may miss trends. Implement continuous monitoring rather than periodic audits to capture real-time shifts in the environment.
8. Continuous Improvement of the Metrics Program 🔁
Just as the architecture evolves, the metrics program must evolve. Regularly review the relevance of existing metrics. Remove those that no longer provide value and add new ones to address emerging risks or opportunities.
Consider the following steps for program maintenance:
- Quarterly Review: Assess if metrics align with current business priorities.
- Feedback Loop: Gather input from stakeholders on the usefulness of reports.
- Tooling Updates: Ensure data collection methods remain efficient and scalable.
- Training: Ensure the team understands how to interpret and act on the data.
By treating the metrics program as a living asset, organizations ensure that their architecture governance remains relevant and effective over time.
9. Summary of Best Practices 📝
To summarize the effective establishment of architecture performance and compliance metrics:
- Align with Strategy: Ensure every metric ties back to a business objective.
- Keep it Simple: Focus on high-impact indicators rather than exhaustive data collection.
- Automate Where Possible: Reduce manual effort to ensure data accuracy and timeliness.
- Segment by Audience: Tailor reporting to the needs of executives, managers, and technical staff.
- Iterate Continuously: Refine the metrics program as the organization and technology landscape change.
- Integrate with TOGAF: Leverage existing governance frameworks to structure the measurement process.
Success in architecture measurement is not about achieving perfect numbers immediately. It is about building a culture of evidence-based decision-making. Over time, this culture leads to a more resilient, compliant, and valuable enterprise architecture.
Organizations that master this discipline gain a competitive advantage. They can adapt faster, manage risk more effectively, and justify their investments with clarity. The journey begins with defining what success looks like and measuring progress toward that definition.