


An Entity-Relationship Diagram, commonly abbreviated as ERD, serves as the blueprint for database design. It provides a visual representation of how data is structured, organized, and related within a system. For anyone entering the field of database management or software architecture, understanding these diagrams is essential. This guide breaks down the core components, notation styles, and best practices without relying on specific tools.
What is an Entity-Relationship Diagram? 🤔
An ERD is a graphical representation of an information system. It depicts the entities, attributes, and relationships between them. Think of it as a map for data. Just as a city map shows roads, buildings, and parks, an ERD shows tables, columns, and connections.
The primary purpose of an ERD is to facilitate communication between stakeholders. Developers, business analysts, and project managers use these diagrams to agree on data requirements before writing a single line of code. This reduces errors and rework later in the development lifecycle.
Key Benefits of Using ERDs
Visual Clarity: Complex data structures become easier to understand when drawn out.
Standardization: Provides a common language for technical and non-technical teams.
Efficiency: Identifies potential issues like redundant data early.
Documentation: Serves as a reference for future maintenance and scaling.
Core Components of an ERD 🔧
Every diagram consists of three fundamental building blocks. Understanding these is the first step toward creating a robust schema.
1. Entities 🏢
An entity represents a real-world object or concept about which data needs to be stored. In a database context, an entity usually corresponds to a table.
Strong Entities: These exist independently. For example, a “Customer” table exists regardless of other tables.
Weak Entities: These depend on another entity for their existence. An “Invoice Item” might not make sense without an “Invoice”.
Entities are typically represented by rectangles. The name inside the rectangle is plural, indicating the table it represents.
2. Attributes 🏷️
Attributes describe the properties or characteristics of an entity. They correspond to columns within a database table.
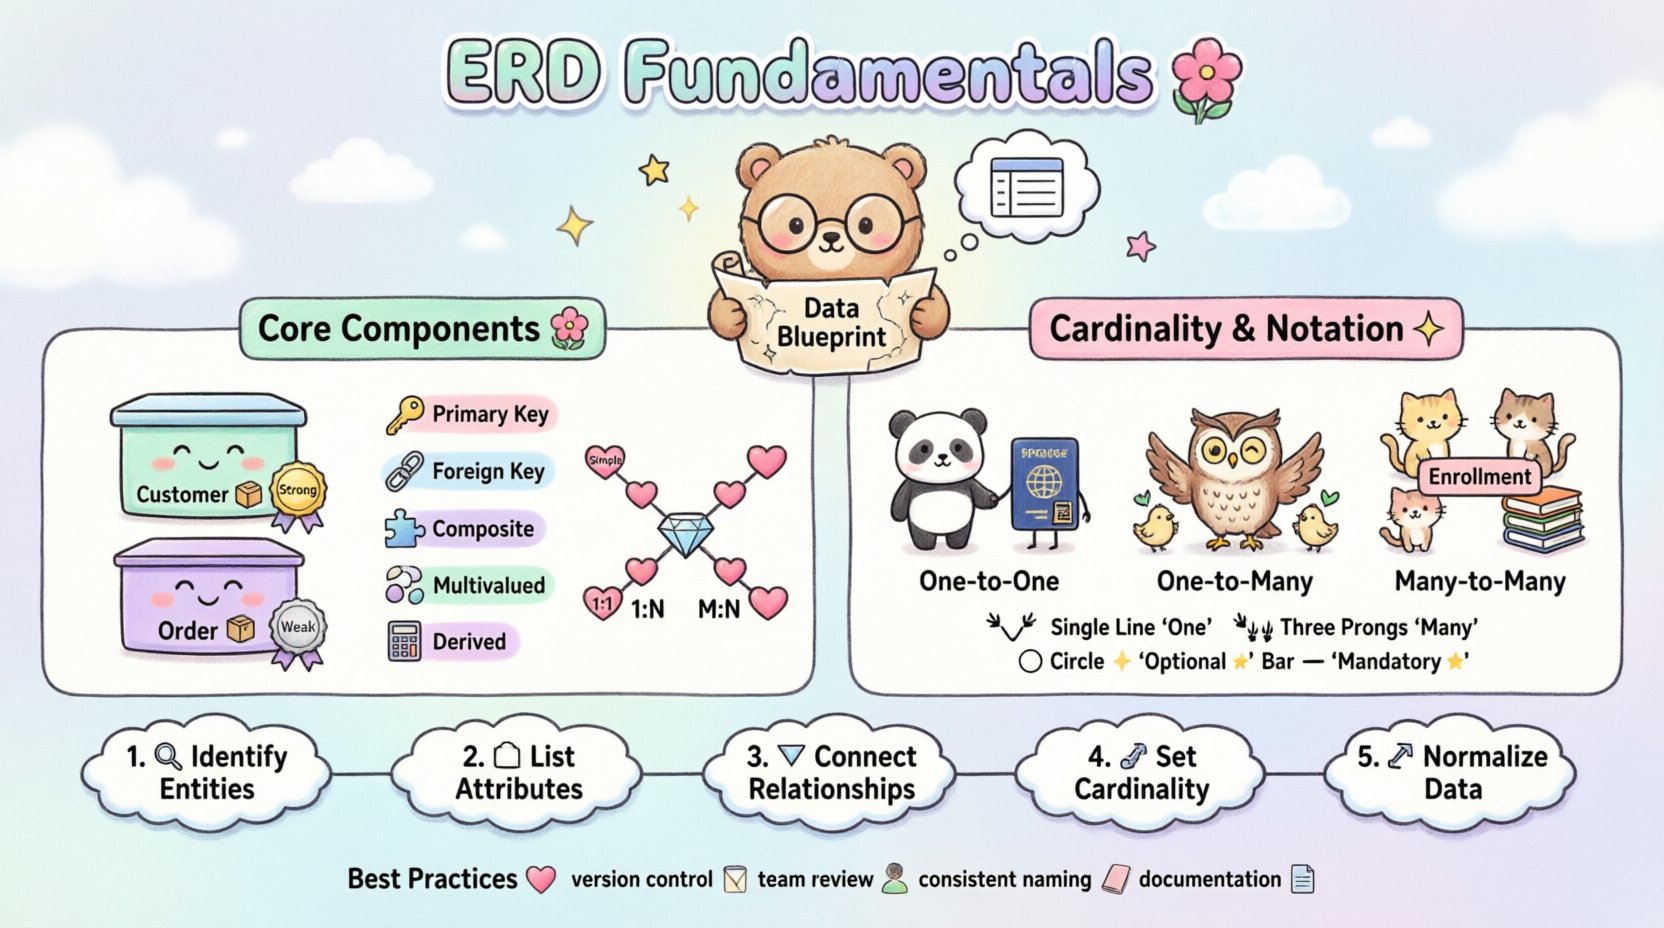
Primary Key: A unique identifier for each record. For a Customer, this might be a “CustomerID”.
Foreign Key: A field that links to the primary key of another table.
Simple Attribute: An indivisible value, like a “PhoneNumber”.
Composite Attribute: An attribute that can be divided into sub-parts, like “Address” (Street, City, Zip).
Multivalued Attribute: An attribute that can hold multiple values, like “EmailAddresses”.
Derived Attribute: A value calculated from other attributes, such as “Age” derived from “DateOfBirth”.
3. Relationships 🔗
Relationships define how entities interact with one another. They describe the connections between data points.
Associative Relationships: These connect two or more entities.
Identifying Relationships: These define the existence of a weak entity.
In diagrams, relationships are often shown as diamonds or lines connecting entities. The type of relationship is defined by cardinality.
Cardinality and Modality 📏
Cardinality defines the number of instances of one entity that can or must relate to each instance of another entity. Modality defines whether the relationship is mandatory or optional.
Types of Cardinality
Cardinality | Description | Example Scenario |
|---|---|---|
One-to-One (1:1) | One instance relates to exactly one other instance. | A Person has one Passport. |
One-to-Many (1:N) | One instance relates to many instances of another. | A Department has many Employees. |
Many-to-Many (M:N) | Many instances relate to many instances of another. | Students enroll in many Courses; Courses have many Students. |
Understanding Modality
Modality indicates if the relationship is mandatory. This is often shown with symbols like a vertical bar or a circle.
Optional (0): An entity can exist without the relationship.
Mandatory (1): An entity must participate in the relationship.
For example, in a “Customer Places Order” relationship:
A Customer must place at least one Order (Mandatory).
An Order can be placed by a Guest (Optional for Customer).
Notation Styles 🎨
Different methodologies exist for drawing ERDs. While the concepts remain the same, the symbols vary.
Chen Notation
Named after Peter Chen, the creator of the ER model. It uses rectangles for entities, diamonds for relationships, and ovals for attributes.
Pros: Very explicit about relationships and attributes.
Cons: Can become cluttered with complex systems.
Crow’s Foot Notation
A variation of Bachman notation. It uses lines with symbols at the ends to indicate cardinality.
Single Line: Represents “one”.
Crow’s Foot (Three prongs): Represents “many”.
Circle: Represents “optional”.
Vertical Bar: Represents “mandatory”.
UML Class Diagrams
Unified Modeling Language diagrams are often used in software engineering. They look similar to ERDs but include more object-oriented concepts like inheritance and methods.
Feature | Chen Notation | Crow’s Foot |
|---|---|---|
Entity Shape | Rectangle | Rectangle |
Relationship Shape | Diamond | Line with Symbols |
Attribute Shape | Oval | Text List |
Readability | High for concepts | High for implementation |
Designing a Database Schema 🛠️
Creating an ERD is not just about drawing shapes. It involves logical thinking about how data flows and interacts. Follow these steps to build a solid foundation.
Step 1: Identify Entities
Look at the business requirements. What objects need to be tracked? List them out.
Who are the actors? (Users, Customers, Employees)
What are the items? (Products, Orders, Invoices)
What are the locations? (Warehouses, Branches)
Step 2: Identify Attributes
For each entity, list the details required. Determine which attributes are unique identifiers.
For “Product”: Name, Price, SKU, Description.
For “User”: Username, Email, PasswordHash, JoinDate.
Step 3: Identify Relationships
How do the entities connect? Ask questions like: “Can a product exist without a category?” or “Can an order exist without a customer?”
Step 4: Define Cardinality
Assign the correct cardinality to each relationship. Be precise about mandatory vs. optional constraints.
Step 5: Normalize the Data
Normalization is the process of organizing data to reduce redundancy. While an ERD shows relationships, the underlying schema should follow normalization rules.
First Normal Form (1NF): Ensure atomic values. No lists in a single cell.
Second Normal Form (2NF): Remove partial dependencies. All attributes must depend on the whole primary key.
Third Normal Form (3NF): Remove transitive dependencies. Attributes should not depend on other non-key attributes.
Common Pitfalls to Avoid ⚠️
Even experienced designers make mistakes. Being aware of common errors helps improve the quality of the diagram.
Over-Normalization: Creating too many tables can slow down queries. Balance normalization with performance needs.
Ignoring Data Types: An ERD is logical, but the implementation requires specific data types (Integer, Varchar, Date).
Missing Constraints: Failing to mark mandatory fields can lead to data integrity issues later.
Complex Relationships: Avoid many-to-many relationships without a junction table. A many-to-many relationship implies a third entity.
Example: Many-to-Many Resolution
If you have “Students” and “Courses”, you cannot connect them directly with a single line. You must introduce a “Enrollment” entity.
Student (1) —- (N) Enrollment
Course (1) —- (N) Enrollment
This creates two one-to-many relationships, which databases handle more efficiently.
Best Practices for Maintenance 📝
Once the diagram is created, it is a living document. It must evolve as the system grows.
Version Control: Keep track of changes to the schema over time.
Review Sessions: Regularly review the diagram with the development team.
Consistent Naming: Use clear, consistent naming conventions for tables and columns.
Documentation: Add notes explaining complex logic or business rules directly on the diagram.
Conclusion 🏁
Mastering the Entity-Relationship Diagram is a critical skill for database design. It bridges the gap between abstract business requirements and concrete technical implementation. By understanding entities, attributes, and relationships, you can build systems that are scalable, maintainable, and efficient.
Remember that clarity is the goal. A diagram should be readable by anyone involved in the project. Use standard notations, adhere to cardinality rules, and always prioritize data integrity. With practice, creating these visual guides will become a natural part of your workflow.