


Bridge the gap between complex data structures and business value. When stakeholders encounter an Entity-Relationship Diagram (ERD), they often see a tangled web of lines and boxes rather than a roadmap for success. This disconnect can stall projects, create budget overruns, and erode trust between development teams and business leaders.
The challenge is not just technical; it is linguistic and psychological. To move forward effectively, you must translate the rigid logic of data modeling into the dynamic language of business goals. This guide explores how to communicate database architecture clearly, ensuring every participant understands the structure without needing a degree in computer science.
🧩 Understanding the Core Concept
Before translating, you must anchor the definition in something familiar. An ERD is essentially a map. It does not show the physical terrain of the land, but it shows how different locations connect, how far apart they are, and which paths are required to travel between them.
- Entities represent the main objects of interest (e.g., Customers, Orders, Products).
- Attributes are the specific details describing those objects (e.g., Name, Price, ID).
- Relationships define how these objects interact (e.g., A Customer places an Order).
When you present this to a non-technical group, avoid starting with definitions. Start with the outcome. Ask them what the system needs to achieve, then show how the diagram supports that achievement.
🚧 Why the Disconnect Happens
Technical communication often fails because it prioritizes precision over accessibility. Stakeholders are not trying to be difficult; they are trying to understand the impact on their work. Several factors contribute to this friction:
- Jargon Overload: Terms like “foreign key,” “normalization,” or “primary key” have no meaning in a boardroom context.
- Abstraction Levels: Developers think in schemas and tables. Executives think in revenue, efficiency, and customer experience.
- Visual Complexity: A dense diagram with many connecting lines looks like noise to someone unfamiliar with the notation.
- Perceived Risk: Non-technical audiences often fear that technical complexity implies hidden costs or delays.
Recognizing these barriers allows you to tailor your presentation. The goal is not to dumb down the information, but to reframe it.
🗺️ Translation Strategies for Clarity
Effective communication relies on analogy. You need to map abstract data concepts to tangible business scenarios. Below are three proven frameworks for explaining ERDs.
1. The City Planning Analogy
Think of the database as a city and the ERD as the city zoning map.
- Entities are neighborhoods (Residential, Commercial, Industrial).
- Attributes are the specific rules within those neighborhoods (e.g., maximum building height, allowed business types).
- Relationships are the roads connecting these neighborhoods.
This helps stakeholders understand that you are defining boundaries and connections before construction begins. If you build a road where there is a river, the city (system) will crash.
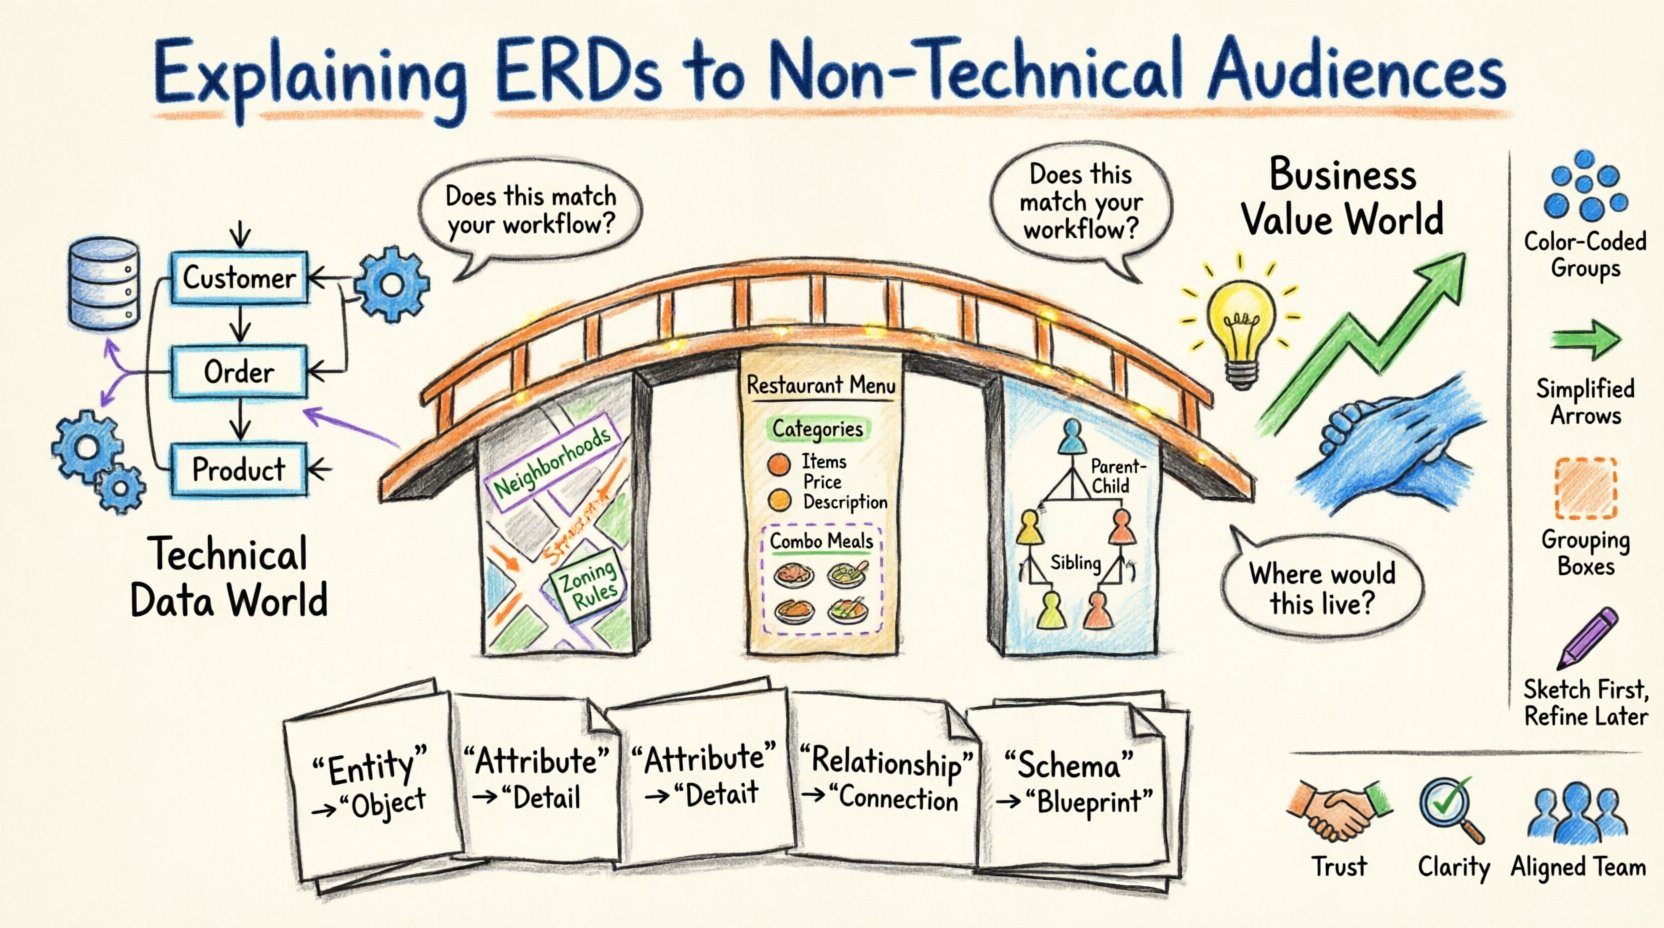
2. The Restaurant Menu Analogy
For e-commerce or inventory systems, a menu is a familiar concept.
- Entities are categories (Appetizers, Mains, Drinks).
- Attributes are the items (Burger, Soda, Salad) with details (Price, Ingredients).
- Relationships are the meal deals (A Burger and Fries together).
This clarifies how data groups together. It shows that an item cannot exist without a category, just as a meal cannot be served without a plate.
3. The Family Tree Analogy
For hierarchical data or organizational structures, this works best.
- Entities are individuals.
- Attributes are names, dates of birth, and locations.
- Relationships are parent-child or spouse connections.
This illustrates how one record links to another. A “Parent” entity links to a “Child” entity. It visualizes the chain of custody and ownership.
📋 Translating Vocabulary
Words matter. Using business terminology instead of technical terminology reduces cognitive load. Use the table below to guide your vocabulary choices during meetings.
| Technical Term | Business Equivalent | Context Example |
|---|---|---|
| Entity | Object / Item | Instead of “Customer Entity”, say “Customer Record”. |
| Attribute | Field / Detail | Instead of “Attribute”, say “Information Point”. |
| Relationship | Connection / Link | Instead of “Foreign Key Relationship”, say “How they connect”. |
| Schema | Structure / Layout | Instead of “Database Schema”, say “Data Blueprint”. |
| Normalization | Organization / Efficiency | Instead of “3NF Normalization”, say “Removing duplicate data”. |
| Primary Key | Unique ID | Instead of “PK”, say “ID Number”. |
| Query | Search / Report | Instead of “SQL Query”, say “Data Request”. |
🎨 Visual Hierarchy and Design
Even with the right words, a cluttered diagram will confuse the audience. Visual hierarchy guides the eye and highlights importance. You do not need specialized software to achieve this; simple design principles apply.
- Grouping: Use boxes or background shading to group related entities. This reduces the number of distinct items the brain has to process.
- Color Coding: Assign colors to business functions. For example, Blue for “Sales”, Green for “Inventory”, Red for “Notifications”.
- Simplification: Remove attributes that are not critical to the current discussion. Focus on the relationships first.
- Direction: Use arrows to show the flow of data. Arrows pointing right imply a process flow.
When presenting, walk the audience through the diagram chronologically. Start with the core entity (the heart of the system) and branch out to the supporting entities. Do not expect them to understand the whole map at once.
🗣️ Facilitating the Discussion
Once the diagram is on the screen, the conversation begins. Your role shifts from presenter to facilitator. You must encourage questions while steering the conversation back to business logic.
Key Questions to Ask
- “Does this flow match how you process this today?”
- “Where would this information live in your current workflow?”
- “Are there any rules here that don’t apply to your department?”
- “What happens if we remove this connection?”
These questions validate the model against reality. If a stakeholder says, “We don’t actually track that data,” you know the diagram has an error. This is a feature, not a bug. It saves money by catching requirements gaps early.
⚠️ Common Pitfalls to Avoid
Even with good preparation, missteps can occur. Awareness of common pitfalls helps you recover quickly.
- Assuming Knowledge: Never assume they know what a “table” is. Treat every term as new.
- Focusing on Structure over Function: Stakeholders care about what the system does, not how it stores data. If they ask about a field, explain its purpose first.
- Defensive Reactions: If a stakeholder challenges a design choice, do not defend the technical implementation. Explain the business constraint that forced the decision.
- Skipping the “Why”: Always explain why a relationship exists. “We link Orders to Customers” is not enough. “We link them so we can track which Customer placed which Order” is the correct explanation.
🔄 Handling Scope Changes
As the project progresses, requirements will shift. New entities may be added, or relationships may change. Communicating these changes requires a structured approach to avoid “scope creep”.
- Impact Analysis: Show how the change affects existing data. “Adding a phone number field requires updating the Customer form and the database storage.”
- Visual Updates: Always show the updated diagram. Do not just describe the change. Visual proof prevents memory errors.
- Approval Workflow: Ensure stakeholders sign off on the updated model. This creates accountability.
- Documentation: Update the glossary. If you add a new term, ensure it is defined in the business vocabulary list.
📈 Measuring Understanding
How do you know if they actually understood the ERD? Listening is not enough. You need active validation methods.
- Teach Back: Ask the stakeholder to explain a specific relationship back to you in their own words.
- Scenario Testing: Present a hypothetical situation. “If a customer returns an item, which records change?” Let them trace the path on the diagram.
- Checklists: Provide a checklist of requirements. Have them tick off which parts of the diagram satisfy each requirement.
If they cannot answer these questions, the diagram is too complex or the explanation was insufficient. Simplify further. Use fewer boxes. More analogies.
🤝 Building Long-Term Trust
Clear communication is not a one-time event; it is a relationship builder. When stakeholders feel they understand the system, they trust the team building it.
- Consistency: Use the same terms in every meeting. Do not switch between “Record” and “Row” and “Table”.
- Patience: Allow silence. Non-technical audiences need time to process the concepts before responding.
- Accessibility: Provide a simplified version of the diagram for them to keep. They should be able to reference it without calling you.
- Transparency: Admit when you do not know an answer. “I need to check the data logic on that, I will get back to you” is better than guessing.
🚀 Moving Forward
Translating an Entity-Relationship Diagram is about respect. It respects the time of the business leader and the integrity of the data. By using analogies, simplifying vocabulary, and focusing on business value, you turn a technical constraint into a strategic asset.
The diagram is not the product; the product is the solution to the business problem. The ERD is simply the proof that you have mapped the solution correctly. When you communicate it effectively, you remove the mystery from technology and replace it with clarity.
Start with the map, not the coordinates. Focus on the destination, not the vehicle. With these strategies, your next presentation will not just be understood; it will be embraced.