


Understanding the landscape in which your organization operates is the cornerstone of sustainable growth. Markets shift, regulations tighten, and consumer behaviors evolve. To navigate this complexity, leaders need a structured method to scan the horizon. The PEST analysis offers a proven framework for this purpose. It categorizes external macro-environmental factors into four distinct pillars, allowing teams to see the big picture without getting lost in the noise.
This guide explores the mechanics of the PEST framework. We will break down each component, discuss how to visualize the data, and explain how to translate findings into actionable strategy. By the end of this article, you will have a clear understanding of how to map external forces for better decision-making.
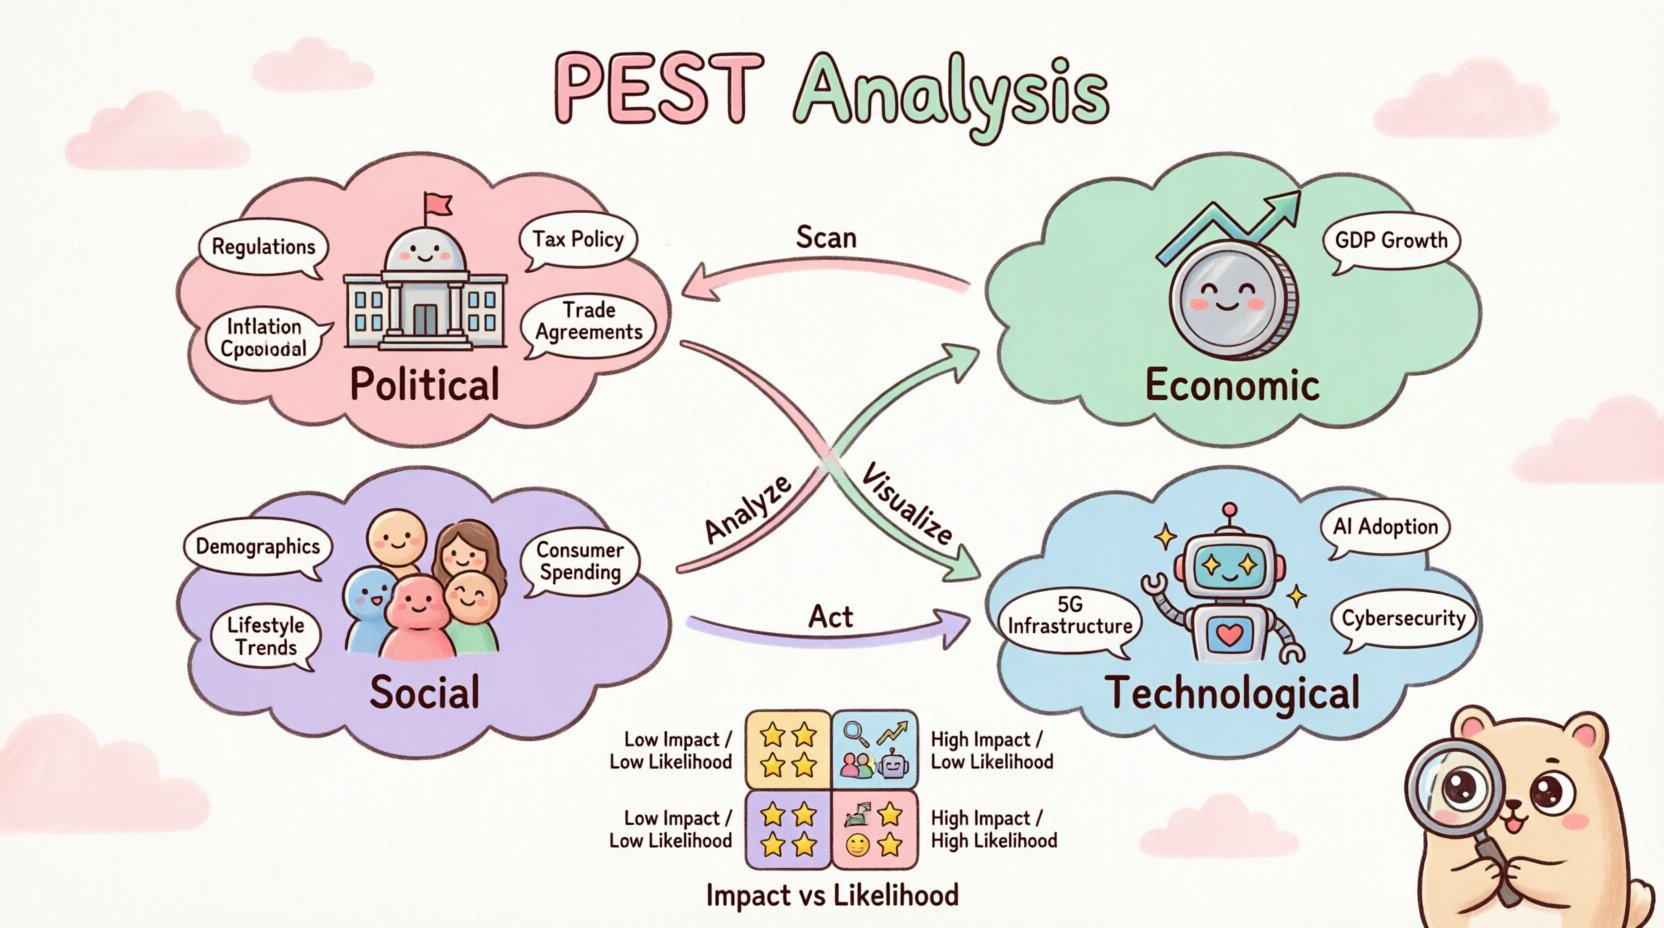
🧩 What is PEST Analysis?
PEST stands for Political, Economic, Social, and Technological. It is a strategic tool used to identify and analyze the external factors that impact an organization. Unlike internal audits, which focus on resources and capabilities, PEST looks outward. It helps businesses anticipate changes before they disrupt operations.
- Political: Government influence on the economy and industry.
- Economic: Economic performance and factors that affect the company.
- Social: The social environment, including demographics and culture.
- Technological: Technological innovations and their impact on the market.
While often used in isolation, this framework is most effective when integrated into broader strategic planning. It provides context for SWOT analyses, helping teams distinguish between internal strengths and external opportunities.
🏛️ The Four Pillars Explained
Deep diving into each letter of the acronym reveals the specific types of data required. Below is a detailed breakdown of what to look for in each category.
🏛️ 1. Political Factors
Political factors relate to government intervention in the economy. They dictate the rules of the game. Stability and policy direction are critical here. When mapping these factors, consider the following:
- Tax Policy: Changes in corporate tax rates can significantly alter profit margins.
- Trade Restrictions: Tariffs and quotas affect import/export costs.
- Employment Laws: Minimum wage regulations and labor rights impact operational costs.
- Environmental Regulations: Compliance costs for sustainability and waste management.
- Political Stability: Risk of regime change or civil unrest affecting market access.
For example, a company planning to expand into a new region must assess if the current administration supports foreign investment or if protectionist policies are rising. Ignoring these signals can lead to stranded assets or regulatory fines.
📉 2. Economic Factors
Economic factors determine the purchasing power of potential customers and the cost of capital. These are often cyclical and require constant monitoring. Key indicators include:
- Economic Growth: GDP trends indicate overall market health.
- Exchange Rates: Fluctuations affect the cost of international sourcing.
- Inflation Rates: High inflation increases input costs and reduces consumer spending.
- Interest Rates: Higher rates increase borrowing costs for expansion.
- Disposable Income: How much money consumers have left after essential expenses.
During a recession, demand for luxury goods typically drops, while essential goods remain stable. Understanding these cycles helps in timing market entry or exit strategies effectively.
👥 3. Social Factors
Social factors reflect the human element of the market. They are about the population and the culture. These trends often shift slowly but have profound long-term impacts. Consider these elements:
- Population Growth: Determines the size of the potential market.
- Age Distribution: An aging population requires different products than a youthful one.
- Health Consciousness: Trends toward wellness affect food, fitness, and insurance sectors.
- Cultural Barriers: Language, traditions, and taboos affect product acceptance.
- Lifestyle Changes: Remote work trends, urbanization, and family structure.
A classic example is the shift toward plant-based diets. Companies that failed to adapt their menus or product lines to this social shift lost market share to competitors who recognized the trend early.
📱 4. Technological Factors
Technological factors cover innovations that create new opportunities or render existing processes obsolete. This is often the fastest-moving pillar. Key areas to monitor include:
- R&D Activity: How much is being invested in new technologies?
- Automation: Impact on labor costs and production efficiency.
- Infrastructure: Internet speed, logistics networks, and energy supply.
- Data Security: Cyber threats and privacy regulations.
- Speed of Adoption: How quickly does the market accept new tech?
Disruption often comes from outside the industry. The rise of streaming technology disrupted physical media, not through better movies, but through better delivery technology.
📈 Visualizing the Data
Collecting data is only the first step. To make the information useful, it must be structured visually. Raw lists are difficult to interpret when comparing impact versus probability. Using matrices and charts helps prioritize actions.
One effective method is the Impact vs. Likelihood Matrix. This grid helps teams categorize factors based on how likely they are to occur and how severe their effect would be.
| Factor Category | Impact Level | Likelihood | Action Required |
|---|---|---|---|
| Regulatory Change | High | Medium | Monitor closely and prepare contingency plans. |
| Consumer Preference Shift | High | High | Immediate strategic adjustment. |
| Raw Material Cost | Medium | Low | Annual review sufficient. |
| New Competitor Entry | Medium | Medium | Market surveillance. |
Visualizing the data in this way allows decision-makers to focus resources on high-priority items. It prevents the team from wasting time on low-probability, low-impact scenarios.
🔄 Integrating into Strategy
Once the analysis is complete and visualized, the next phase is integration. The insights must feed directly into the strategic planning cycle. Here is how to connect the dots:
- SWOT Alignment: Map PEST findings to the Opportunities and Threats sections of a SWOT analysis.
- Risk Management: Use the likelihood data to update risk registers.
- Product Roadmap: Ensure upcoming features align with technological and social trends.
- Resource Allocation: Direct budget toward areas identified as high growth or high risk.
It is crucial to treat this as a dynamic process. A PEST analysis conducted today may be outdated in six months. Regular reviews keep the strategy relevant.
🚧 Common Pitfalls to Avoid
Even with a solid framework, execution errors can lead to misleading results. Be wary of these common mistakes:
- Static Thinking: Treating the analysis as a one-time event rather than an ongoing process.
- Internal Bias: Focusing only on data that supports pre-existing beliefs.
- Information Overload: Collecting too much data without filtering for relevance.
- Lack of Context: Ignoring local nuances when applying global trends.
- Ignoring Interconnections: Failing to see how a political change might trigger an economic shift.
For instance, a political decision to subsidize renewable energy (Political) directly impacts the cost of electricity (Economic) and accelerates adoption of electric vehicles (Technological). These factors are rarely isolated.
🌍 Real-World Application Scenarios
Consider a retail company expanding internationally. They must analyze:
- Political: Is the local government stable? Are there import tariffs?
- Economic: Is the currency strong? Can customers afford the price point?
- Social: Do local shopping habits favor online or in-store? What are the cultural norms regarding customer service?
- Technological: Is the payment infrastructure reliable? Is mobile internet penetration high?
Without this analysis, the company might open stores in areas with low purchasing power or launch a mobile app in a region with poor connectivity. The PEST framework prevents these costly missteps.
🤔 Frequently Asked Questions
Is PEST the same as PESTLE?
PESTLE is an extension of PEST. It adds two more factors: Legal and Environmental. While PEST covers broad political and social issues, Legal and Environmental provide more specific detail on compliance and sustainability. Many organizations use PESTLE for greater granularity.
How often should we perform a PEST analysis?
There is no fixed rule. For fast-moving industries like technology, a quarterly review is common. For stable industries like utilities, an annual review may suffice. The frequency should match the volatility of the market.
Can small businesses use this framework?
Absolutely. Small businesses face the same external forces as large corporations. A local restaurant must consider local tax laws (Political), inflation on food costs (Economic), dietary trends (Social), and delivery apps (Technological). The scale changes, but the need for analysis remains.
What tools are needed to create a PEST analysis?
You do not need specialized software. Spreadsheets are sufficient for data collection. The value lies in the analysis, not the tool. Simple charts and diagrams can effectively visualize the findings for stakeholders.
How does PEST differ from Competitor Analysis?
Competitor analysis focuses on specific rivals within your industry. PEST analysis looks at the macro-environment affecting the entire industry. Both are necessary for a complete strategic view. PEST sets the stage; competitor analysis defines the players.
🔍 Final Thoughts on External Mapping
Strategic clarity comes from understanding constraints and opportunities. The PEST analysis provides a disciplined way to scan the environment. By categorizing factors into Political, Economic, Social, and Technological buckets, teams can avoid overlooking critical shifts.
Visualizing this data through matrices and charts transforms abstract information into concrete strategic inputs. It moves the conversation from speculation to evidence-based planning. Regular updates ensure the organization remains agile in a changing world.
Start by gathering data on these four pillars. Map them against your current strategy. Identify the gaps. This process builds resilience and prepares your organization for whatever comes next.
Remember, the goal is not to predict the future perfectly. It is to be prepared for multiple possibilities. With a clear map of external forces, you can navigate uncertainty with confidence.