


In times of stability, strategic planning often follows a linear trajectory. Organizations have months to gather data, conduct surveys, and analyze market trends before making a move. However, when volatility strikes—whether through geopolitical shifts, economic downturns, or public health emergencies—this luxury evaporates. The standard PEST analysis (Political, Economic, Social, Technological) requires time that crises do not afford.
This guide details the methodology for Rapid PEST Evaluation. It is designed for executives and strategists who need to navigate uncertainty without sacrificing analytical rigor. We focus on high-impact indicators, accelerated data collection, and decisive interpretation. The goal is not just speed, but precision under pressure.
Why Standard PEST Fails in Emergency Scenarios ⏳
Traditional PEST analysis is a static snapshot. It assumes a level of continuity that crisis environments rarely possess. Relying on last quarter’s reports or annual economic forecasts during a disruption leads to blind spots. The primary issues include:
- Latency: By the time data is compiled, the situation has evolved.
- Depth vs. Breadth: Standard methods often skim surface-level factors to maintain a broad view, missing critical signals.
- Static Assumptions: It treats external factors as constant variables rather than dynamic forces.
- Resource Drain: Extensive research teams are needed, which may be redeployed to operational firefighting.
A rapid approach shifts the focus from comprehensive data to signal detection. It prioritizes the factors that drive immediate survival and short-term adaptation.
The Rapid PEST Framework Structure 🔍
The Rapid PEST model condenses the four macro-environmental categories into actionable intelligence. Instead of a 50-page report, the output is a structured decision matrix. Each category is interrogated for specific crisis triggers.
1. Political Factors: Stability and Regulation 🏛️
Political stability dictates the operating environment. In a crisis, government intervention often increases. Rapid evaluation here focuses on three core pillars:
- Regulatory Changes: Are there immediate bans, mandates, or tax shifts? For example, lockdown orders or supply chain embargoes.
- Geopolitical Risk: How do international tensions affect cross-border operations? Trade routes may shift overnight.
- Government Support: What relief packages or subsidies are available? Knowing eligibility criteria quickly is vital for liquidity.
Key Question: What political action will alter our cost structure or market access within the next 30 days?
2. Economic Factors: Liquidity and Demand 💰
Economic conditions dictate cash flow and purchasing power. During a crisis, historical economic models often break down. Rapid assessment requires looking at real-time indicators.
- Liquidity Constraints: Are credit lines tightening? What is the current interest rate environment for emergency borrowing?
- Consumer Spending: Is demand shifting to essentials? Are luxury segments collapsing or stabilizing?
- Supply Chain Costs: Are raw material prices volatile? Is logistics capacity available at a viable price?
Key Question: Where is our cash flow most exposed, and what revenue streams remain resilient?
3. Social Factors: Behavior and Workforce 🧑🤝🧑
Social dynamics influence customer acceptance and employee retention. Crises often accelerate social trends. A rapid evaluation identifies shifts in public sentiment and workforce capability.
- Health and Safety Concerns: Do customers fear physical interaction? Is remote work a permanent shift or temporary?
- Workforce Availability: Are key staff members at risk? What is the morale and retention risk?
- Public Sentiment: How is the brand perceived during the crisis? Are there social movements impacting the industry?
Key Question: How has the social contract between us and our stakeholders changed?
4. Technological Factors: Tools and Security 💻
Technology enables adaptation. In a crisis, digital infrastructure becomes critical. Rapid evaluation assesses capability and vulnerability.
- Digital Infrastructure: Can systems handle increased remote traffic? Is cloud stability sufficient?
- Security Risks: Does the shift to remote work expose vulnerabilities? Are phishing attacks increasing?
- Innovation Velocity: Can we pivot products or services using existing tech stacks?
Key Question: What technology is the bottleneck, and what is the enabler?
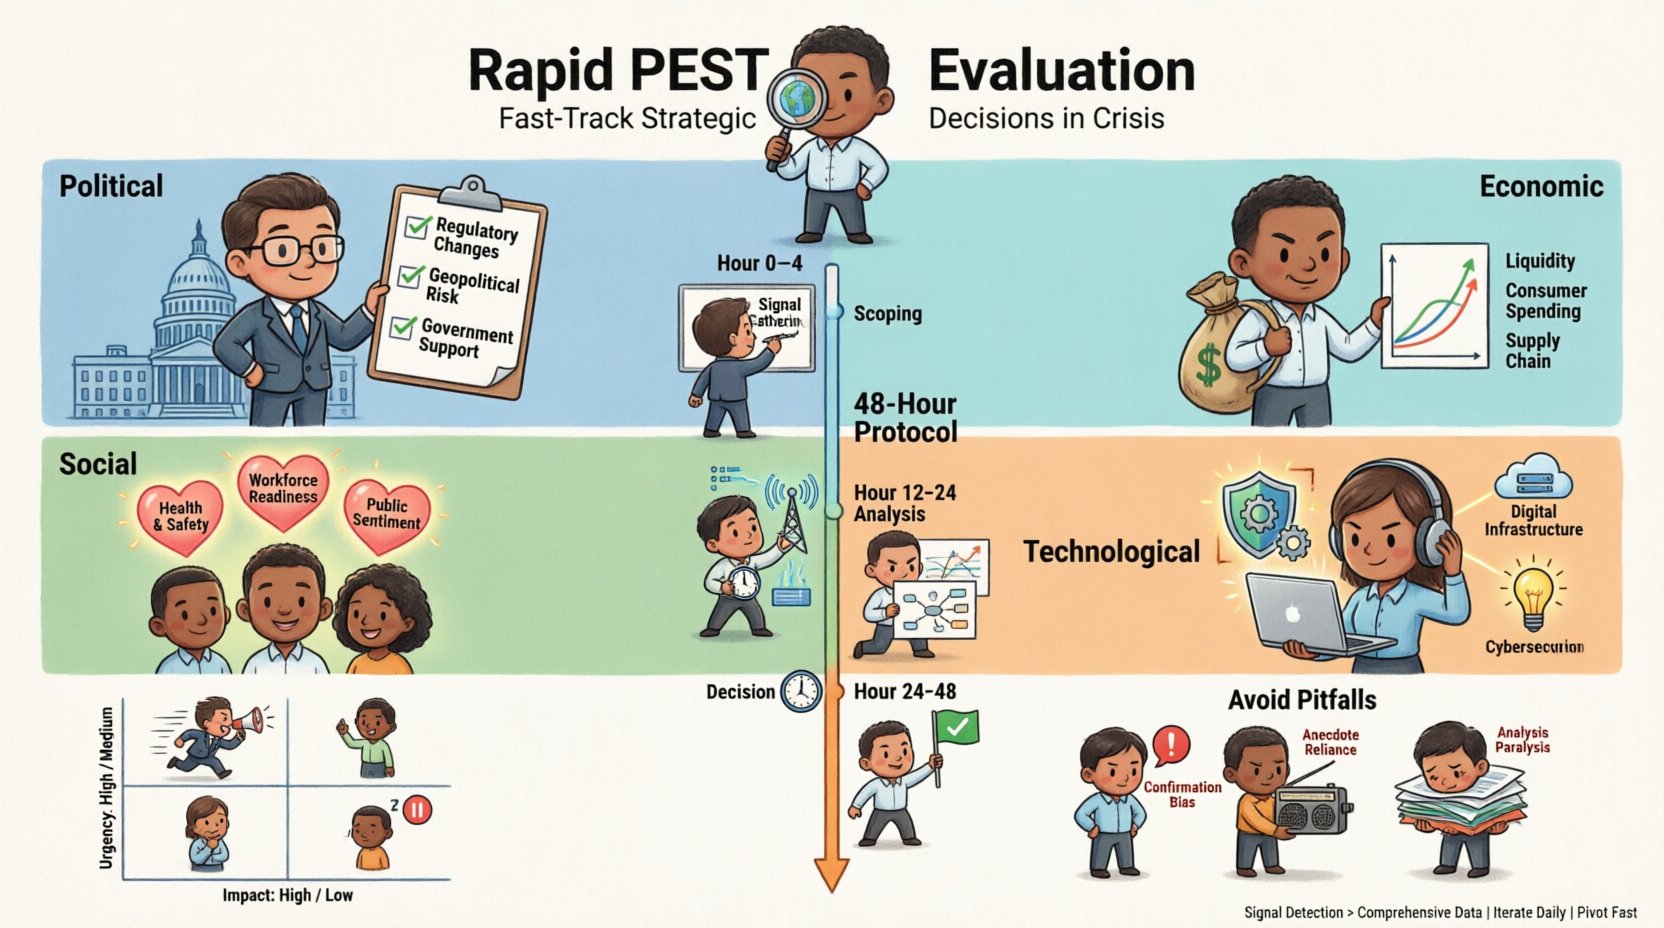
Implementation: The 48-Hour Protocol 🏃♂️
To execute a Rapid PEST Evaluation, follow this structured timeline. This protocol assumes a cross-functional team is already mobilized.
- Hour 0-4: Scoping and Team Assembly
- Define the specific crisis scope (e.g., regional, global, sector-specific).
- Assign a lead for each PEST quadrant.
- Identify key data sources (internal reports, news feeds, regulatory filings).
- Hour 4-12: Signal Gathering
- Collect hard data (financials, orders, outages).
- Monitor soft signals (social media sentiment, employee feedback).
- Review recent government announcements.
- Hour 12-24: Analysis and Synthesis
- Map findings against the Rapid PEST matrix.
- Identify the top three risks and top three opportunities.
- Draft preliminary strategic options.
- Hour 24-48: Decision and Communication
- Present findings to the executive board.
- Finalize the strategic pivot or continuation plan.
- Communicate the direction to stakeholders.
Structuring the Analysis: A Comparison Table 📋
Using a table helps visualize the difference between standard and rapid analysis. This ensures the team understands the shift in focus.
| Factor | Standard PEST Focus | Rapid PEST Focus (Crisis) | Data Source |
|---|---|---|---|
| Political | Long-term policy trends | Immediate regulatory changes | Government portals, legal counsel |
| Economic | GDP growth, annual inflation | Cash flow, supply chain breaks | Banking partners, logistics logs |
| Social | Demographic shifts, lifestyle trends | Immediate safety concerns, morale | Surveys, HR feedback, social media |
| Technological | Adoption rates, R&D pipeline | System uptime, security risks | IT logs, vendor status pages |
Deep Dive: Specific Crisis Scenarios 🌪️
The application of Rapid PEST varies depending on the nature of the disruption. Below are examples of how the framework adapts to specific contexts.
Scenario A: Supply Chain Collapse 🚢
- Political: Check for export controls or border closures in key sourcing regions.
- Economic: Assess cost of alternative logistics and inventory holding costs.
- Social: Evaluate customer patience and willingness to wait for delayed goods.
- Technological: Leverage digital platforms for real-time inventory tracking.
Scenario B: Pandemic or Health Emergency 🦠
- Political: Comply with health mandates and capacity limits.
- Economic: Manage liquidity as revenue streams halt or pivot.
- Social: Address employee health and customer safety expectations.
- Technological: Enable remote work infrastructure and e-commerce capabilities.
Scenario C: Geopolitical Conflict ⚔️
- Political: Assess sanctions, trade embargoes, and asset freezes.
- Economic: Hedge currency risk and manage energy costs.
- Social: Navigate public sentiment and boycott risks.
- Technological: Secure data sovereignty and communication channels.
Prioritization Matrix 🎯
Not all factors carry equal weight. Use this matrix to rank findings based on impact and urgency.
| Impact Level | High Urgency | Medium Urgency |
|---|---|---|
| High Impact | Immediate Action Required Example: Loss of license, critical infrastructure failure. |
Monitor Closely Example: Competitor pricing shift, minor regulation. |
| Low Impact | Delegate Example: Temporary website downtime. |
Acknowledge Example: Long-term demographic shift. |
Common Pitfalls in Rapid Analysis ⚠️
Speed introduces risk. The following errors frequently undermine rapid strategic decisions.
- Confirmation Bias: Searching only for data that supports a pre-determined decision. Always challenge the initial hypothesis.
- Over-reliance on Anecdotes: Social media sentiment is volatile. Use it as a signal, not absolute proof.
- Ignoring Internal Capacity: External factors are useless if the internal team cannot execute the response.
- Analysis Paralysis: Waiting for perfect data. In a crisis, 80% accuracy is often better than 100% accuracy that arrives too late.
- Siloed Thinking: Keeping PEST factors separate. They interact. Economic shifts drive political action; political action drives technological investment.
Monitoring and Iteration 🔄
A Rapid PEST Evaluation is not a one-time event. The environment remains fluid. Establish a feedback loop to track changes.
- Daily Check-ins: For critical factors (e.g., liquidity, supply status).
- Weekly Reviews: For broader trends (e.g., sentiment, regulatory updates).
- Triggers for Re-evaluation: Define specific thresholds. If inventory drops below X, re-run the Economic analysis immediately.
Documentation is key. Record the rationale for every decision. If the situation changes, you can trace back why a specific pivot was made and adjust accordingly. This creates an audit trail for accountability and learning.
Integrating with Strategic Planning 📝
How does this rapid output feed into long-term strategy? The insights gained during the crisis phase often reshape the annual plan.
- Budget Allocation: Shift funds from non-essential projects to crisis mitigation.
- Resource Reallocation: Move personnel to high-priority areas identified in the Social or Technological analysis.
- Risk Management: Update the enterprise risk register with new variables discovered during the PEST scan.
- Scenario Planning: Use the Rapid PEST findings to build new “What If” scenarios for the next fiscal year.
Case Example: The 2020 Digital Pivot 💡
Consider a retail organization facing physical closure. A standard PEST would have taken months to analyze the shift to e-commerce. A Rapid PEST approach allowed them to act in weeks.
- Political: Confirmed restrictions on physical stores were temporary but strict.
- Economic: Identified that digital advertising costs were dropping due to market saturation.
- Social: Noticed a surge in demand for contactless delivery options.
- Technological: Audited existing e-commerce platform for load capacity.
The result was a 40% revenue retention during the closure period. The speed of the analysis allowed them to capture market share from slower competitors.
Final Thoughts on Crisis Agility 🛡️
Strategic agility is not about guessing. It is about structuring information to reduce uncertainty. The Rapid PEST Evaluation provides a disciplined framework for navigating the fog of a crisis. It ensures that decisions are grounded in external reality rather than internal fear.
By focusing on high-impact signals and iterating quickly, organizations can survive disruption and emerge with a competitive advantage. The market rewards those who adapt faster than the environment changes. This framework is the tool that enables that speed.
Keep the data flowing. Keep the team aligned. And always be ready to pivot when the signals shift.