


When constructing software architecture or defining system behavior, visual modeling serves as the bridge between abstract requirements and concrete implementation. Two of the most prominent tools in the Unified Modeling Language (UML) toolbox are the Use Case Diagram and the Activity Diagram. While both are essential for understanding how a system functions, they operate at different levels of abstraction and serve distinct purposes in the development lifecycle.
Confusion often arises when teams attempt to use these diagrams interchangeably. This guide provides a deep dive into the structural, semantic, and practical distinctions between them. We will explore their components, appropriate use cases, and how they integrate to form a cohesive system model.
Understanding the Use Case Diagram 📊
The Use Case Diagram is primarily concerned with the functional requirements of a system from the perspective of an external observer. It answers the question: “What can the system do?” rather than “How does the system do it?”
Core Components
- Actors: Represent the users or external systems that interact with the system. Actors can be human users, other software applications, or hardware devices. They are depicted as stick figures.
- Use Cases: Represent a specific goal or function that the system provides. These are usually drawn as ovals.
- System Boundary: A rectangle that encloses the use cases, defining what is inside the system and what is outside.
- Associations: Lines connecting actors to use cases, indicating that the actor interacts with that specific functionality.
Relationships in Use Case Modeling
Beyond simple associations, Use Case Diagrams utilize specific relationship types to add depth to the requirement definition:
- Include: Indicates that one use case always incorporates the behavior of another. For example, a “Place Order” use case might always include a “Validate Payment” use case.
- Extend: Indicates optional behavior that occurs under specific conditions. For instance, a “Checkout” use case might be extended by a “Apply Discount” use case if a valid code exists.
- Generalization: Represents inheritance relationships between actors (e.g., a “Premium Member” is a type of “Member”) or use cases.
When to Deploy This Diagram
This diagram is most effective during the requirements gathering phase. It helps stakeholders visualize the scope of the project without getting bogged down in technical details. It is ideal for:
- Defining the boundaries of the system.
- Communicating features to non-technical clients.
- Identifying the primary users and their goals.
Understanding the Activity Diagram 🔄
The Activity Diagram is essentially a flowchart that represents the workflow of a system. It answers the question: “How does the system behave step-by-step?” It focuses on the logic, control flow, and data flow within the system.
Core Components
- Activity Nodes: Represent actions or tasks performed by the system or users.
- Control Flow: Directed arrows that show the sequence of activities.
- Fork and Join Nodes: Symbols used to indicate parallel processing or the synchronization of multiple flows.
- Decision Nodes: Diamond shapes that represent points where the flow splits based on a condition (e.g., Yes/No).
- Swimlanes: Vertical or horizontal bands that organize activities by who or what performs them (e.g., User, System, Database).
Granularity and Logic
Unlike the Use Case Diagram, which stays at a high level, the Activity Diagram dives into the logic. It can model:
- Complex conditional logic.
- Concurrent processes.
- Data movement between steps.
- Exception handling paths.
When to Deploy This Diagram
This diagram is typically used during the design and development phases. It is crucial for:
- Specifying the algorithm behind a specific use case.
- Designing business processes.
- Clarifying complex interactions that cannot be captured in a simple list of features.
Side-by-Side Comparison 📋
To clarify the distinctions, we can compare the two diagrams across several critical dimensions. Understanding these differences prevents the common pitfall of creating overly complex requirement documents or overly vague design specifications.
| Feature | Use Case Diagram | Activity Diagram |
|---|---|---|
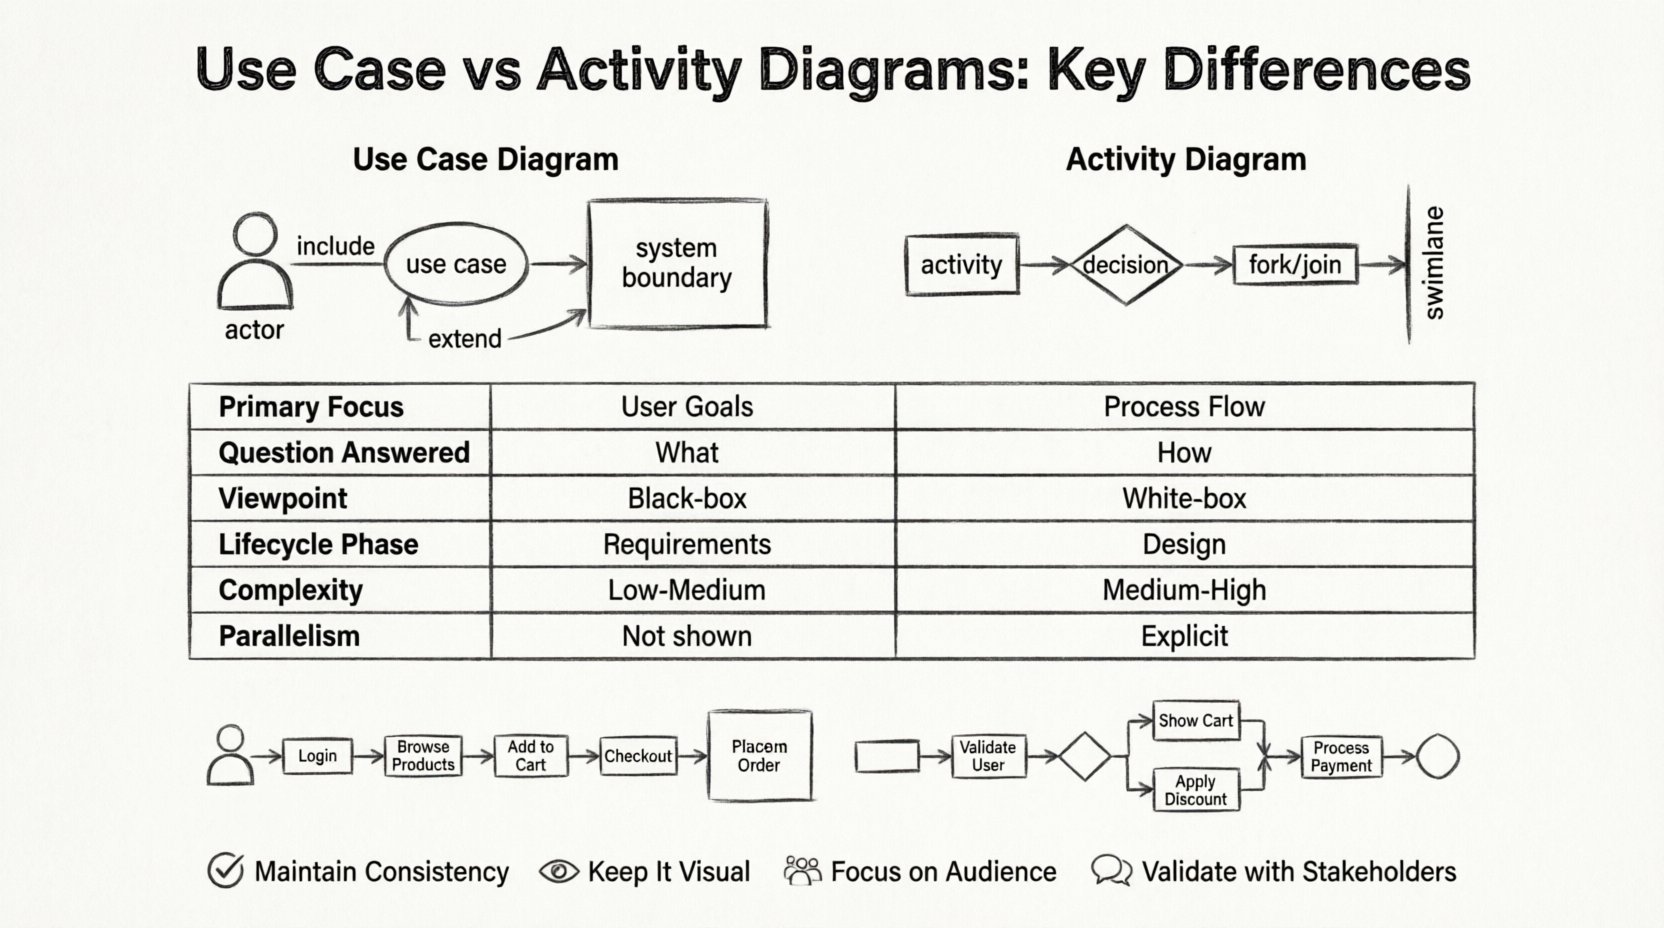
| Primary Focus | System functionality and user goals | Process flow and logic execution |
| Question Answered | What does the system do? | How does the system do it? |
| Viewpoint | External (Black-box) | Internal (White-box) |
| Key Symbols | Actors, Ovals, Lines | Nodes, Arrows, Diamonds, Forks |
| Lifecycle Phase | Requirements Analysis | Design and Implementation |
| Complexity | Low to Medium | Medium to High |
| Parallelism | Not typically shown | Explicitly modeled with Fork/Join |
Deep Dive: The E-Commerce Example 🛒
To illustrate the practical application of both diagrams, let us consider an online store. We will trace the “Place Order” scenario using both modeling techniques.
Use Case Perspective
In the Use Case Diagram, the focus is on the user’s intent. The diagram would show:
- An Actor labeled “Customer”.
- A Use Case labeled “Place Order”.
- Relationships indicating that “Place Order” includes “Login” and “Select Payment Method”.
- Another Use Case for “Browse Catalog”.
This tells the project manager and the client exactly what features need to be built. It does not matter if the payment gateway is called via API or a web form; that is an implementation detail irrelevant to the Use Case Diagram.
Activity Diagram Perspective
In the Activity Diagram for “Place Order”, the focus shifts to the steps:
- Start Node: The process begins when the user clicks “Checkout”.
- Decision Node: Is the user logged in? If No, route to “Login”. If Yes, continue.
- Activity: Display Cart Items.
- Decision Node: Are items available? If No, notify user. If Yes, proceed.
- Fork Node: Split flow into two parallel paths: one to “Update Inventory” and one to “Process Payment”.
- Join Node: Wait for both inventory update and payment to succeed before proceeding.
- Final Node: Display “Order Confirmed” message.
This diagram guides the developers on the logic flow, error handling, and concurrency requirements.
Common Modeling Mistakes ⚠️
Even experienced modelers can fall into traps that reduce the utility of these diagrams. Being aware of common errors ensures your documentation remains clear and actionable.
Using Use Cases for Logic
A frequent error is attempting to describe the internal logic of a feature within a Use Case Diagram. If you find yourself drawing decision diamonds or arrows showing the sequence of steps inside a Use Case, you have likely drifted into Activity Diagram territory. Use Cases should remain static representations of functionality.
Overcomplicating Activity Diagrams
Conversely, Activity Diagrams can become spaghetti charts if every minor detail is included. If an activity diagram contains more than 50 nodes, it is often too complex to be useful. Break large processes down into sub-activities or helper diagrams. Use swimlanes to manage complexity by assigning responsibility clearly.
Mixing Actors and Objects
In Use Case Diagrams, Actors represent roles, not specific instances. Avoid naming an actor “John Doe”; instead, name it “Registered User”. In Activity Diagrams, objects should be represented as object nodes, distinct from the control flow. Confusing these leads to ambiguity regarding who is responsible for which action.
Integration: How They Work Together 🤝
These diagrams are not mutually exclusive; they are complementary. A robust system model often utilizes both in a hierarchical manner.
Top-Down Modeling Approach
- Start with Use Cases: Establish the high-level scope. Identify the major features and user interactions.
- Identify Complex Use Cases: Review the Use Case Diagram to find functions that are particularly intricate or require significant logic.
- Create Activity Diagrams: For those complex use cases, create detailed Activity Diagrams to define the internal workflow.
- Refine Requirements: The details discovered in the Activity Diagram may reveal new requirements, which can be fed back into the Use Case Diagram as new use cases.
This iterative process ensures that the system is designed both functionally and logically. It prevents the scenario where developers build a system that meets the requirements but fails to handle the internal processes correctly.
Best Practices for Effective Modeling 🏆
To maximize the value of your diagrams, adhere to the following guidelines:
1. Maintain Consistency
Ensure naming conventions are consistent across all diagrams. If a use case is named “Process Payment” in the Use Case Diagram, the corresponding activity should be labeled “Process Payment” in the Activity Diagram. Consistency aids in traceability.
2. Keep It Visual
Diagrams are meant to be read quickly. Avoid cluttering them with excessive text. If a description is needed, attach it as a note or comment rather than writing it inside the flow shapes.
3. Focus on the Audience
Ask who will read this diagram. If it is for a client, use the Use Case Diagram. If it is for the development team, use the Activity Diagram. Tailor the level of detail to the reader’s technical knowledge.
4. Validate with Stakeholders
Do not create diagrams in isolation. Walk through the Use Cases with product owners to validate scope. Walk through the Activity Flows with architects to validate feasibility. Feedback loops are essential for accuracy.
Technical Nuances and Extensions 🛠️
While the standard UML definitions provide a solid foundation, real-world modeling often requires extending these concepts.
State Machine Considerations
Sometimes, the behavior of an object is best described by its states rather than its activities. If your system has complex state transitions (e.g., an order moving from “Pending” to “Shipped” to “Delivered”), a State Machine Diagram might be more appropriate than an Activity Diagram. However, Activity Diagrams can still model the logic that triggers these state changes.
Sequence Integration
Activity Diagrams often feed into Sequence Diagrams. Once the flow of an Activity Diagram is established, developers can extract the interactions between objects to create a Sequence Diagram. This creates a chain of documentation from high-level requirements to low-level interaction details.
Impact on Development Lifecycle 📈
The choice of which diagram to prioritize can influence the speed and quality of the development process.
- Agile Methodologies: Use Case Diagrams are often favored in Agile for sprint planning because they represent user stories. Activity Diagrams are used within the sprint for detailed task breakdown.
- Waterfall Methodologies: Both are heavily utilized during the design phase before coding begins. The Activity Diagram serves as a blueprint for the code structure.
- Legacy Modernization: When reversing engineering existing systems, Activity Diagrams are often created first to understand the current logic, followed by Use Case Diagrams to understand the user-facing capabilities.
Conclusion on Selection Strategy ✅
Selecting the right diagram is not about preference; it is about the specific information needed at a specific time. If you need to define the boundary of the system and what value it delivers to the user, the Use Case Diagram is the tool. If you need to define the logic, the algorithm, or the process flow required to deliver that value, the Activity Diagram is necessary.
By understanding the structural differences, the semantic nuances, and the appropriate lifecycle phase for each, you can create documentation that truly aids communication and development. Avoid the temptation to force one diagram to do the work of the other. Instead, let them complement each other, building a complete picture of the system from the user’s perspective down to the machine’s logic.
Effective modeling is a discipline that requires precision and clarity. Whether you are mapping out a new enterprise solution or refining a consumer application, applying these distinctions will lead to more robust architectures and fewer misunderstandings among the team.