


Software development methodologies have shifted dramatically over the past decade. While the Waterfall model relied heavily on upfront documentation, modern approaches prioritize adaptability and continuous delivery. Amidst this transition, the role of visual modeling tools has come under scrutiny. Specifically, the use case diagram—a staple of systems analysis—faces questions regarding its relevance in fast-paced environments.
Many practitioners assume these diagrams belong to the past, reserved for rigid, specification-heavy projects. However, a deeper analysis reveals that use case diagrams are adapting. They are evolving from static documents into dynamic communication tools that bridge the gap between business requirements and technical implementation. This guide explores how these diagrams integrate into Agile sprints and DevOps pipelines without becoming a bottleneck.
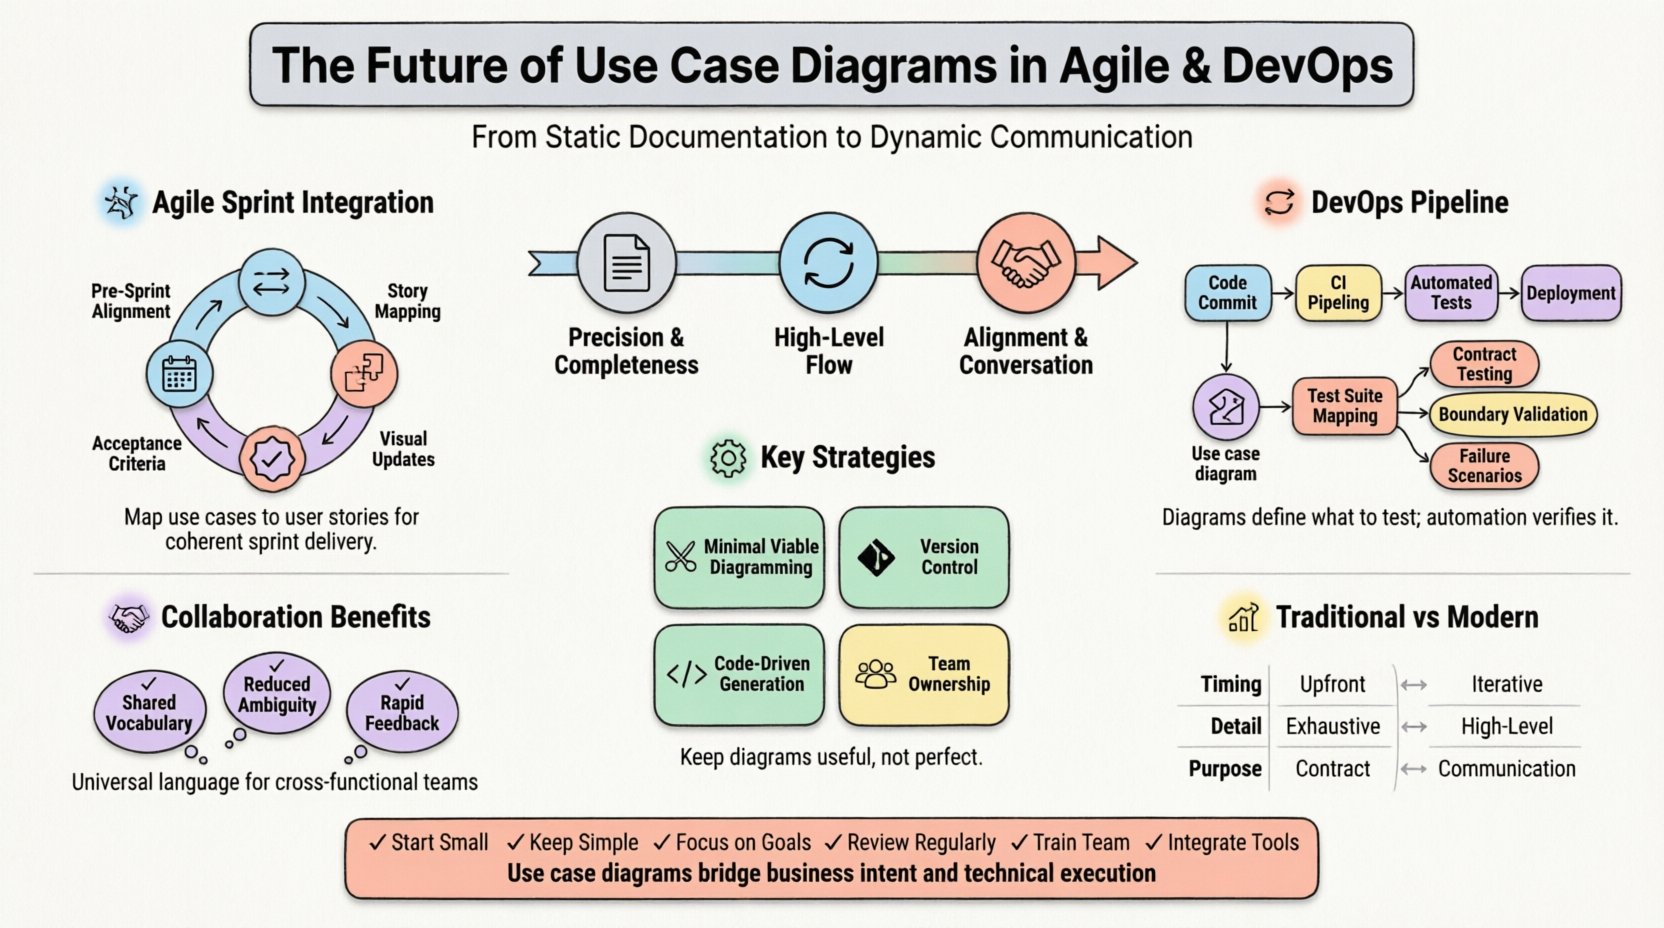
Understanding the Shift: From Documentation to Communication 📄
In traditional development lifecycles, a use case diagram served as a contract. It defined the system boundary, the actors involved, and the specific interactions before a single line of code was written. The goal was precision and completeness. In contrast, Agile and DevOps value working software over comprehensive documentation. This fundamental difference often leads teams to discard diagrams entirely.
However, discarding them creates a blind spot. Without a visual representation of the system’s scope, teams risk scope creep or misunderstood requirements. The future of use case diagrams lies not in their preservation as static artifacts, but in their transformation into living communication aids. They are no longer about proving you read a spec; they are about aligning understanding.
- Static vs. Dynamic: Old diagrams were read-only. New diagrams are collaborative.
- Detail vs. Overview: The focus shifts from exhaustive detail to high-level flow.
- Documentation vs. Conversation: The diagram becomes the prompt for discussion, not the final word.
This shift requires a change in mindset. Instead of creating a diagram to satisfy a process, teams create them to solve communication gaps. This approach ensures that the visual model serves the team, rather than the team serving the model.
Integrating Use Cases into Agile Sprints 🏃
Agile development operates in iterations. User stories drive the backlog, and sprints deliver value. Where does a system-level diagram fit into this rhythm? The answer lies in mapping the diagram to the user story format. A user story describes a specific value proposition from the perspective of a user. A use case describes the interaction required to fulfill that value.
Bridging the Gap Between Stories and Diagrams
When a team plans a sprint, they often focus on individual stories. A use case diagram provides the context. It shows how multiple stories interact within the same boundary. For example, a story regarding “User Login” is a single slice of the “Authentication” use case.
To make this work in a sprint:
- Pre-Sprint Alignment: Before planning, the team reviews the relevant section of the diagram. This ensures everyone understands the boundary conditions.
- Story Mapping: Decompose the use case into the specific steps required to complete the interaction. Each step becomes a potential user story or task.
- Acceptance Criteria: Use the diagram flows to define acceptance criteria. If the diagram shows a “Timeout” interaction, the acceptance criteria must reflect how the system handles that timeout.
- Visual Updates: If a story introduces a new interaction, update the diagram immediately. This keeps the visual model synchronized with the code.
This integration prevents the common Agile pitfall of building isolated features that do not fit together. The diagram acts as the glue, ensuring that every sprint contributes to a coherent whole.
Use Case Diagrams in DevOps and CI/CD Pipelines 🔄
DevOps focuses on the continuous integration and deployment of software. The pipeline automates testing, building, and releasing. One might ask how a static diagram fits into an automated pipeline. The answer is in the definition of boundaries and testing scenarios.
In a mature DevOps environment, testing is automated. However, automation scripts need to know what to test. Use case diagrams define the functional boundaries. They tell the test automation framework what interactions are valid and what inputs are expected.
Mapping Diagrams to Automated Tests
Each use case can correspond to a specific test suite. When a developer commits code, the CI pipeline runs these tests. If a use case flow is broken, the pipeline fails. This creates a feedback loop where the diagram validates the code.
- Contract Testing: The diagram acts as a contract between the frontend and backend. Automated tests verify that the contract is upheld.
- Boundary Validation: The diagram defines the system boundary. Integration tests ensure that interactions crossing this boundary work correctly.
- Failure Scenarios: Diagrams often show error flows (e.g., “Invalid Input”). These scenarios must be explicitly tested in the pipeline.
This approach moves diagrams from the realm of documentation into the realm of quality assurance. They become the source of truth for what the system should do, which the automated tests verify continuously.
Maintaining Diagrams in a High-Velocity Environment ⚙️
The biggest criticism of use case diagrams in modern environments is maintenance. In a fast-moving project, diagrams can become outdated within days. If the diagram does not match the code, it creates confusion and distrust. To solve this, teams must adopt strategies that reduce maintenance overhead.
Strategies for Living Diagrams
- Minimal Viable Diagramming: Only diagram what is complex. Simple flows often do not need a diagram. Focus on the system architecture and critical interactions.
- Version Control: Treat diagrams like code. Store them in the same repository. Commit changes alongside code updates. This allows teams to see who changed the model and why.
- Code-Driven Diagrams: Some tools allow generating diagrams from code. While not always perfect, this ensures the visual model reflects the actual implementation.
- Team Ownership: No single architect should own the diagram. It should be a shared artifact. Any developer can update it if they notice a discrepancy.
By treating the diagram as a collaborative asset rather than a deliverable, teams reduce the friction of updating it. The goal is to keep the model useful, not perfect.
Collaboration and Cross-Functional Teams 🤝
Agile and DevOps rely on cross-functional teams. Developers, testers, product owners, and operations engineers work together. A use case diagram serves as a universal language in this setting. It is more accessible to a product owner than technical architecture, yet more precise than a verbal description.
During sprint planning or review meetings, the diagram facilitates discussion. It allows stakeholders to point to specific actors or interactions and ask questions. “What happens if the external service is down?” can be answered by looking at the error flows in the diagram.
Visualizing the User Journey
Product owners often struggle to visualize the technical impact of their requirements. A use case diagram translates business needs into system actions. It helps product owners understand the complexity of a request. For example, adding a new feature might require a new actor or a new interaction. Seeing this visually helps manage expectations regarding effort and time.
- Shared Vocabulary: Terms like “Actor” and “System” become standard references.
- Reduced Ambiguity: Visual flows reduce the chance of misinterpretation compared to text alone.
- Rapid Feedback: Stakeholders can validate the model quickly before development begins.
This shared understanding reduces rework. When everyone agrees on the diagram, the team builds the right thing, rather than building things that need to be changed later.
Challenges and Limitations ⚠️
While use case diagrams offer value, they are not a silver bullet. Teams must be aware of the challenges to avoid common pitfalls.
Over-Engineering
It is easy to create diagrams that are too detailed. A diagram showing every button click is rarely useful. The focus should remain on the user’s goal, not the implementation details. If the diagram becomes as complex as the code, it fails its purpose.
Tool Dependency
Teams often rely on specific software to create diagrams. If the team changes tools, the diagrams can become inaccessible. It is important to use standard formats that can be read by multiple tools. Portability ensures the diagrams remain assets, not liabilities.
Static Representation
A diagram is a snapshot. It cannot show the timing of events or the state of the system at different moments. For complex state transitions, other modeling techniques might be necessary. Use case diagrams work best for describing functional requirements, not behavioral states.
Comparison: Traditional vs. Modern Usage
To clarify the evolution of this modeling technique, the following table contrasts traditional practices with modern Agile and DevOps adaptations.
| Aspect | Traditional Approach | Modern Agile/DevOps Approach |
|---|---|---|
| Timing | Created during analysis phase, before coding. | Created or updated iteratively during sprints. |
| Detail Level | High detail, exhaustive specification. | High level, focused on key flows and boundaries. |
| Ownership | Owned by a dedicated architect or analyst. | Owned collaboratively by the development team. |
| Format | Static PDF or paper document. | Live digital file in version control. |
| Purpose | Contract and sign-off. | Communication and alignment. |
| Testing Link | Separate document from test plans. | Directly mapped to automated test cases. |
| Maintenance | Low priority, often ignored. | High priority, updated with code changes. |
This comparison highlights that the tool itself has not changed significantly, but its role in the process has shifted. The modern approach treats the diagram as a service to the team, rather than a deliverable to a stakeholder.
Future Trends and Automation 🤖
Looking ahead, the integration of artificial intelligence and automation will further change how use case diagrams are used. We are moving towards a future where diagrams are generated from code or requirements automatically.
AI-Generated Models
Artificial intelligence can analyze user stories and code repositories to suggest use case diagrams. This reduces the manual effort required to create and maintain them. The human role shifts from drawing boxes to validating the AI’s suggestions. This ensures the diagram remains accurate without consuming developer time.
Real-Time Synchronization
Future tools may offer real-time synchronization between the diagram and the code. If a developer adds a new method that handles a specific interaction, the diagram updates automatically. This creates a “single source of truth” where the visual model is always current.
Interactive Diagrams
Static diagrams are becoming less common. Interactive diagrams allow users to click on an actor and see the specific user stories associated with that interaction. This links the visual model directly to the backlog, making the connection between design and work explicit.
Best Practices for Implementation ✅
To successfully adopt use case diagrams in a modern environment, teams should follow specific best practices. These guidelines ensure the diagrams add value without slowing down progress.
- Start Small: Begin by diagramming only the core functionality. Do not attempt to model every edge case immediately.
- Keep it Simple: Limit the number of actors. Group similar users into a single actor to reduce complexity.
- Focus on Goals: Ensure every use case has a clear goal. If a flow does not deliver value, it does not belong in the diagram.
- Review Regularly: Make diagram review a part of the sprint retrospective. Discuss what is outdated and needs updating.
- Train the Team: Ensure all team members understand the notation. A diagram is useless if only one person can read it.
- Integrate with Tools: Use diagramming tools that integrate with your project management system. This allows for easy linking and tracking.
Adhering to these practices helps maintain the diagram as a valuable asset. It prevents the model from becoming a forgotten document buried in a repository.
The Role of the System Boundary 🛡️
One of the most critical elements of a use case diagram is the system boundary. In Agile and DevOps, this boundary often shifts. Features might move from the core system to microservices or third-party integrations. The diagram must reflect these changes.
When a feature is moved to a new service, the use case remains the same, but the actor or the system implementation changes. Updating the diagram to reflect this ensures the team understands the architectural impact. It highlights where the responsibility lies. This clarity is essential for DevOps, where ownership of services is often distributed.
Without a clear boundary, teams may assume a feature is part of the core system when it is actually external. This leads to integration errors and deployment failures. The diagram acts as a map, showing where the system ends and the external world begins.
Conclusion on Value and Evolution 💡
The use case diagram remains a powerful tool for system design, provided it is used correctly. In Agile and DevOps environments, it serves as a bridge between business intent and technical execution. It is not about creating perfect documentation; it is about fostering shared understanding.
By integrating diagrams into sprints, linking them to automated tests, and maintaining them collaboratively, teams can leverage this tool without sacrificing speed. The future of use case diagrams is not in the past, but in their ability to adapt to the fast pace of modern software delivery. As automation improves, the diagram will become even more integrated with the code, serving as a living map of the system’s functionality.
Teams that embrace this evolution will find that their diagrams reduce confusion, improve testing coverage, and align stakeholders more effectively. The goal is to use the diagram to build better software, not to build a diagram for the sake of compliance.