


Systems engineering relies heavily on the ability to model complexity without losing sight of physical reality. While Block Definition Diagrams (BDD) and Internal Block Diagrams (IBD) define structure and connectivity, the Parametric Diagram introduces the mathematical rigor necessary to validate performance. In modern engineering environments, moving from qualitative descriptions to quantitative constraints is often the difference between a concept that looks good on paper and a system that functions in operation.
This guide explores the mechanics, application, and strategic value of SysML Parametric Diagrams. We will examine how constraint blocks define relationships, how solvers process these definitions, and how these technical artifacts directly influence high-stakes engineering decisions.
What Are Parametric Diagrams? 🧩
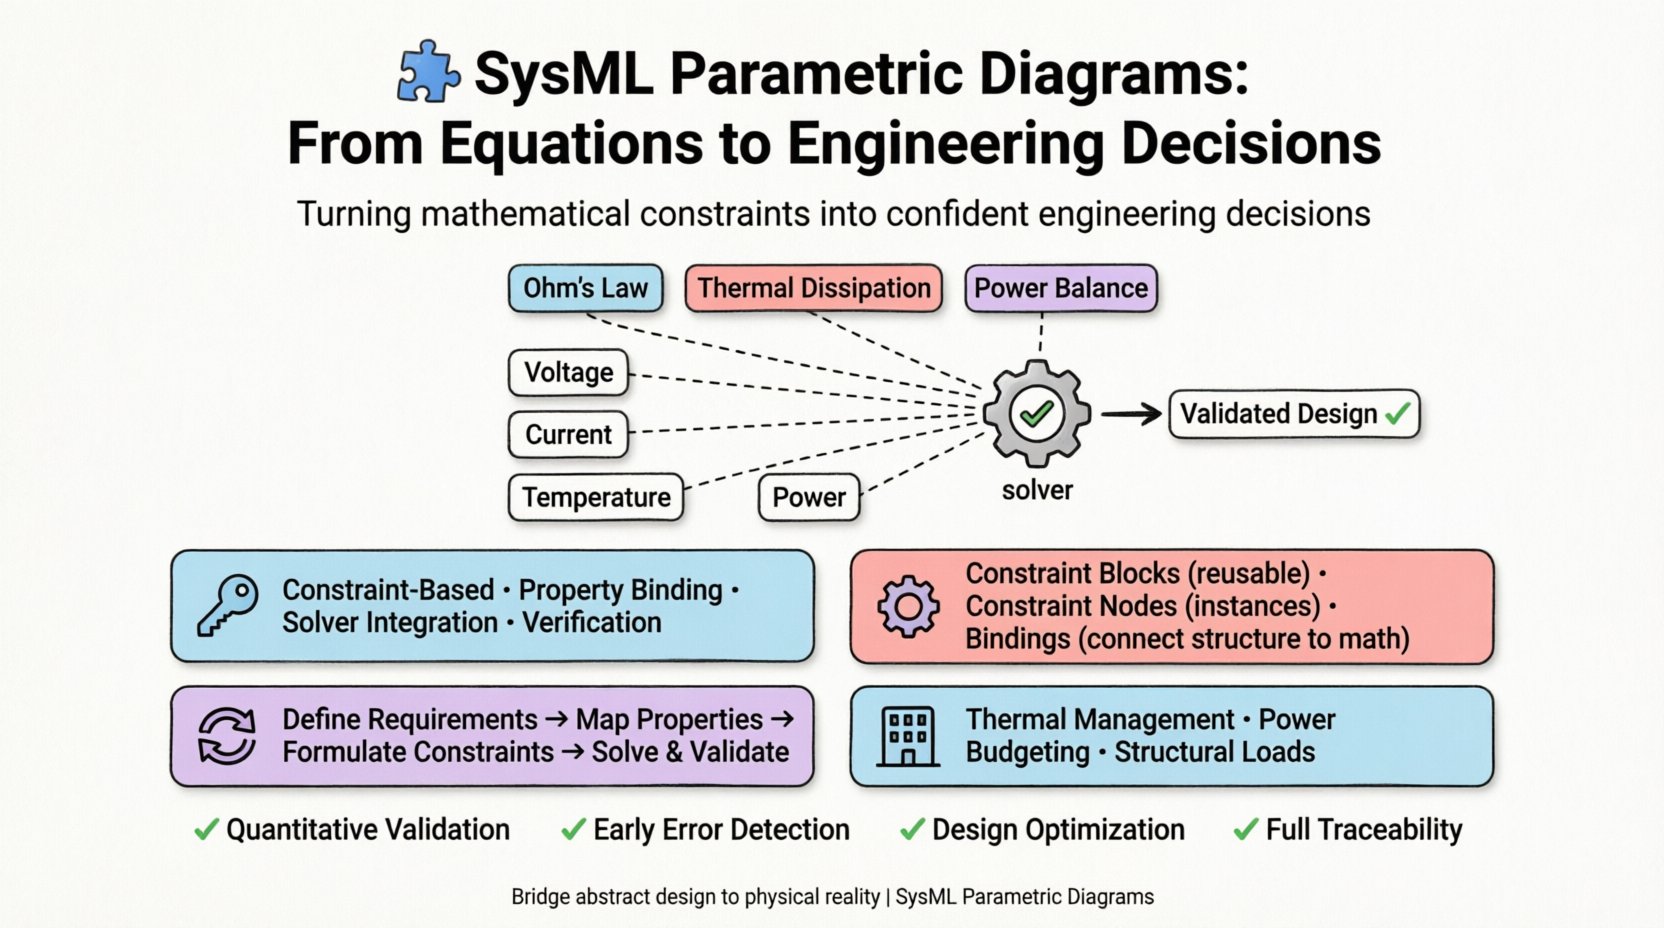
Parametric diagrams are the specific SysML mechanism for expressing mathematical relationships between system properties. Unlike other diagrams that focus on topology or hierarchy, this diagram type focuses on behavior through equations. It allows engineers to define constraints that must be satisfied for a system to be considered valid.
Consider a scenario where a battery pack must power a motor under specific load conditions. A structural diagram shows the connection. A parametric diagram defines the relationship: Voltage equals Current times Resistance. If the model violates this, the system is invalid. This capability transforms the model from a static map into a dynamic simulation environment.
Key Characteristics
- Constraint-Based: Relationships are defined via equations or logical conditions.
- Property Binding: Properties from blocks are linked to variables within constraints.
- Solver Integration: External or internal solvers calculate values based on known inputs.
- Verification: Provides a formal method to check if design choices meet requirements.
Core Components Explained ⚙️
To utilize parametric diagrams effectively, one must understand the building blocks. These elements work together to create a solvable system of equations.
1. Constraint Blocks
A Constraint Block represents a set of variables and the equations that relate them. It is reusable. For instance, a “Thermal Dissipation” constraint block could be created once and applied to multiple components like a CPU, a motor, or a battery cell. This promotes consistency across the model.
- Variables: Inputs, outputs, and intermediate values within the constraint.
- Equations: The mathematical logic (e.g.,
P = V * I). - Reusability: One definition serves many instances.
2. Constraint Nodes
Constraint nodes are instances of constraint blocks placed on a parametric diagram. They serve as the specific application of the rule. A single constraint block might define the physics of a spring, but you would create multiple constraint nodes for each spring in the assembly to ensure they all follow the same rule.
3. Bindings and Connectors
Bindings connect the properties of blocks (like mass or voltage) to the variables of constraint nodes. This links the structural model to the parametric model. Without bindings, the equations exist in isolation and cannot interact with the actual system data.
- Direct Binding: Connects a property directly to a variable.
- Equation Solver: The system attempts to satisfy all equations simultaneously.
The Engineering Workflow 🔄
Integrating parametric diagrams into a workflow requires discipline. It is not merely a drawing exercise; it is a data validation process.
Step 1: Define Requirements
Before drawing equations, requirements must be clear. Is the requirement a limit (e.g., temperature < 80°C) or a relationship (e.g., power output depends on speed)? Parametric diagrams handle relationships best.
Step 2: Map Properties
Identify which block properties are relevant. Do not bind every property. Focus on those that influence performance. This keeps the model maintainable and the solver efficient.
Step 3: Formulate Constraints
Write the equations. This often involves collaboration between systems engineers and domain specialists (thermal, electrical, mechanical). Ambiguity here leads to solver errors.
Step 4: Solve and Validate
Run the solver. If the system is over-constrained (too many equations), it may fail to find a solution. If under-constrained (too few), multiple solutions may exist. The goal is a well-posed problem where the solution represents the physical reality.
Real-World Scenarios 🏗️
Understanding the theory is one thing; seeing the application is another. Below are specific domains where parametric diagrams drive tangible outcomes.
1. Thermal Management
Heat generation and dissipation are critical in electronics and propulsion. A parametric model can calculate steady-state temperatures based on power dissipation and cooling capacity.
- Input: Power loss of components.
- Constraint: Thermal resistance and surface area equations.
- Output: Component temperature.
If the output exceeds the material limit, the engineer knows to increase cooling or reduce power immediately, avoiding physical prototyping costs.
2. Power Budgeting
For electric vehicles or satellites, power is a finite resource. Parametric diagrams ensure the sum of consumption does not exceed generation.
- Generation: Solar array efficiency times irradiance.
- Consumption: Active mode current times duty cycle.
- Constraint: Generation minus Consumption equals Battery Charge.
3. Structural Loads
Calculating stress on a frame involves mass, acceleration, and geometry. Parametric diagrams link the mass properties defined in the block definition diagram to the stress equations.
- Mass: Derived from volume and density.
- Force: Mass times acceleration.
- Stress: Force divided by cross-sectional area.
Impact on Decision Making 📊
The primary value of parametric diagrams is not the diagram itself, but the decisions it supports. By quantifying trade-offs, engineers can choose the optimal path rather than the safest or most obvious one.
Trade-off Analysis
When multiple design options exist, parametric models allow for direct comparison.
| Design Option | Weight | Performance | Constraint Status |
|---|---|---|---|
| Option A (Lightweight) | 10 kg | High | Pass |
| Option B (Standard) | 15 kg | Medium | Pass |
| Option C (Heavy Duty) | 20 kg | Very High | Fail (Thermal) |
In this example, Option C might offer the highest performance, but the parametric analysis reveals a thermal failure. This eliminates a risky path before significant investment is made.
Risk Reduction
Uncertainty is a major risk in engineering. Parametric diagrams force explicit definition of variables. When a variable is unknown, the constraint highlights it. This allows teams to identify where data is missing and prioritize testing or data collection.
Cost Optimization
Over-designing is expensive. If a component can handle the load with 20% margin, using a component with 100% margin wastes budget. Parametric constraints define the exact limit, allowing for right-sizing of components.
Common Challenges 🛑
Despite the benefits, implementing parametric modeling introduces specific difficulties. Awareness of these pitfalls prevents wasted effort.
- Model Complexity: As the system grows, the number of constraints increases exponentially. Managing this requires modularization of constraint blocks.
- Equation Solving: Not all equations are linear. Non-linear equations may require iterative solving, which can be computationally expensive.
- Unit Consistency: Mixing units (e.g., metric vs. imperial) within constraints leads to silent errors. Explicit unit definitions are mandatory.
- Version Control: Equations change frequently. Tracking changes to the mathematical logic is as important as tracking the code.
Best Practices ✅
To maintain a healthy parametric model, follow these guidelines.
- Modularize: Create generic constraint blocks for common physics (e.g., Ohm’s Law, Newton’s Second Law) rather than hardcoding equations everywhere.
- Document Logic: Add comments to constraints explaining the source of the equation. Do not rely solely on the visual representation.
- Validate Early: Run solvers on small subsystems before integrating the full system. This isolates errors quickly.
- Separate Concerns: Keep the structural model separate from the parametric model. Changes in physical layout should not require rewriting equations.
- Use Parameters: Define parameters for variables that are likely to change (e.g., efficiency factors) rather than hardcoding constants.
Integration with Other SysML Diagrams 🔗
Parametric diagrams do not exist in isolation. They are part of a larger ecosystem of modeling artifacts.
Requirement Diagrams
Requirements often state performance limits. Parametric diagrams verify these limits. A requirement stating “Max Temperature 80°C” is verified by a constraint calculating the temperature.
Block Definition Diagrams
BDDs define the properties (attributes) that the parametric diagram binds to. A property defined as “Real” in the BDD can be used as a variable in the parametric diagram.
State Machine Diagrams
Systems often change modes (e.g., idle vs. active). Parametric constraints can be conditional. Different equations apply depending on the state of the system.
Future Trends in Parametric Modeling 🚀
The landscape of systems modeling is evolving. The integration of parametric diagrams with broader data ecosystems is becoming standard.
- Cloud-Based Solving: Moving computation to the cloud allows for larger, more complex models to be solved without local hardware limitations.
- AI-Assisted Modeling: Algorithms may suggest constraint structures based on historical data, reducing the manual effort of equation formulation.
- Digital Twins: Parametric models serve as the mathematical core of digital twins, allowing real-time simulation based on sensor data.
Summary of Benefits
To recap, the strategic value of parametric diagrams includes:
- Quantitative Validation: Moving from “looks right” to “mathematically correct”.
- Early Detection: Finding errors before physical prototypes are built.
- Optimization: Identifying the most efficient design point.
- Traceability: Linking physical properties to performance outcomes.
By embedding mathematical logic directly into the system model, organizations gain a powerful tool for decision-making. The effort required to maintain these diagrams pays off in reduced risk and improved system performance. The transition from qualitative to quantitative modeling is not just a technical upgrade; it is a shift in engineering rigor.
Final Thoughts on Implementation 📝
Adopting parametric modeling requires a change in mindset. It asks engineers to define their assumptions explicitly. It removes the hidden variables that often cause failures in complex systems. While the learning curve exists, the long-term stability and predictability of the engineering process justify the investment.
Start small. Pick a subsystem with clear performance requirements. Define the constraints. Run the solver. Observe the results. Let the data guide the design. This iterative approach builds confidence and competence within the team.
In the end, the goal is not just to create a model, but to create a reliable system. Parametric diagrams are the bridge between abstract design and physical reality.