


In systems engineering, the Systems Modeling Language (SysML) serves as the backbone for defining complex requirements, structures, and behaviors. However, selecting the appropriate diagram type is not merely a matter of preference; it is a critical decision that impacts communication, verification, and validation. Engineers often face the challenge of determining which view of the system best addresses a specific problem. This guide explores the distinctions between SysML diagram types, providing a framework for making informed modeling choices.
Each diagram type offers a unique perspective. Using the wrong view can lead to ambiguity, while using the correct view clarifies intent and reduces the risk of design errors. We will examine structural, behavioral, and requirement diagrams to understand their specific applications within the engineering lifecycle.
🏗️ Structural Diagrams: Defining Composition and Flow
Structural diagrams focus on the static aspects of a system. They describe the parts that make up the system and how those parts relate to one another. These diagrams are foundational, establishing the vocabulary and topology that behavioral diagrams will later act upon.
Block Definition Diagram (BDD)
The Block Definition Diagram is often the starting point for any SysML model. It defines the types of blocks that exist within the system hierarchy. Think of this as the architectural blueprint for the system’s composition.
- Primary Function: Defines block types, properties, and sub-blocks.
- Best Used For: High-level decomposition, defining interfaces, and establishing inheritance relationships.
- Key Elements: Blocks, properties, references, and value properties.
Practitioners choose the BDD when they need to answer questions such as “What are the components of this system?” or “How is the system hierarchically organized?” It is essential for capturing the “noun” side of the system. For example, in an aerospace context, a BDD would define the “Propulsion System,” “Guidance System,” and “Payload” as distinct blocks, and specify how the “Guidance System” is a part of the overall “Vehicle.”
When modeling complex systems, the BDD allows for multiple levels of abstraction. You might have a top-level BDD showing the major subsystems, and subsequent BDDs that drill down into the details of the “Propulsion System.” This separation of concerns keeps the model manageable.
Internal Block Diagram (IBD)
While the BDD defines the *types* of blocks, the Internal Block Diagram defines the *instances* and their connections. It is the diagram that shows how specific blocks are wired together to achieve system functionality.
- Primary Function: Shows connections (flows) between specific block instances.
- Best Used For: Defining interface ports, flow properties, and signal/data transmission paths.
- Key Elements: Ports, flow properties, connectors, and reference properties.
Engineers select the IBD when the physical or logical connection between components is the primary concern. If the question is “How does the sensor data get to the controller?”, the IBD is the correct tool. It visualizes the flow of information or material.
Consider a scenario involving a thermal management system. The BDD would define a “Heat Sink” block. The IBD would show how the “Heat Sink” connects to a “Pump” via a “Fluid Flow” port. Without the IBD, the model lacks the connectivity details necessary for simulation or physical implementation.
Parametric Diagram
The Parametric Diagram is unique among SysML diagrams because it focuses on the mathematical constraints that govern system behavior. It links structural properties to equations.
- Primary Function: Captures constraints and equations that define performance limits.
- Best Used For: Performance modeling, sizing calculations, and verification of design constraints.
- Key Elements: Constraint blocks, constraint properties, and connectors.
When a system requires rigorous performance validation, the Parametric Diagram becomes indispensable. For instance, if an engineering team needs to verify that a battery pack can sustain a specific discharge rate without overheating, they use parametric constraints. They define variables for current, resistance, and temperature, then link them to the relevant blocks.
Practitioners choose this diagram when the “how much” or “how fast” questions arise. It bridges the gap between the physical structure and the mathematical reality of the system.
🔄 Behavioral Diagrams: Capturing Logic and Interaction
Behavioral diagrams describe how the system changes over time. They capture the dynamic aspects of the system, including interactions with the environment and internal state changes.
Use Case Diagram
The Use Case Diagram provides a high-level view of system functionality from the perspective of external actors.
- Primary Function: Defines the functional requirements and the scope of the system.
- Best Used For: Stakeholder communication and initial requirements gathering.
- Key Elements: Actors, use cases, and relationships.
This diagram is often used early in the lifecycle. It answers “Who interacts with the system?” and “What does the system do for them?” It is less concerned with implementation details and more with the value proposition. For example, in a medical device context, actors might include “Doctor,” “Patient,” and “Maintenance Technician,” with use cases like “Diagnose Condition” or “Calibrate Sensor.”
It serves as a communication tool between engineers and non-technical stakeholders. It ensures that the system being built aligns with user needs.
Activity Diagram
The Activity Diagram is similar to a flowchart but includes the full power of SysML, such as object flows and swimlanes.
- Primary Function: Describes the logic of a single operation or workflow.
- Best Used For: Modeling complex processes, decision logic, and concurrent activities.
- Key Elements: Actions, control flows, object flows, and swimlanes.
When the focus is on the sequence of steps or the flow of data through a process, the Activity Diagram is the standard choice. It is particularly effective for modeling operational procedures. For example, the “Launch Sequence” of a rocket would be modeled here, showing the steps from “Ignition” to “Stage Separation” with decision points for “Engine Status.”
Practitioners prefer this over sequence diagrams when the order of operations is more important than the timing of interactions between specific objects. It handles concurrency well, allowing parallel branches of logic to be visualized.
Sequence Diagram
The Sequence Diagram focuses on the interaction between objects over time. It is a vertical representation where time moves downwards.
- Primary Function: Details the exchange of messages between components.
- Best Used For: Analyzing timing, interaction protocols, and message ordering.
- Key Elements: Lifelines, messages, and activation bars.
Engineers choose the Sequence Diagram when the specific timing and order of messages are critical. In software-intensive systems, this is often the default choice for defining interface protocols. If the system relies on a strict handshake protocol to ensure data integrity, the Sequence Diagram makes those requirements explicit.
It complements the Activity Diagram. While the Activity Diagram shows *what* happens, the Sequence Diagram shows *how* the components talk to each other to make it happen.
State Machine Diagram
The State Machine Diagram describes the lifecycle of a single object or subsystem, focusing on states, events, and transitions.
- Primary Function: Models the dynamic behavior of a system or component based on events.
- Best Used For: Control logic, embedded software, and systems with distinct modes of operation.
- Key Elements: States, transitions, events, and guards.
This diagram is essential for systems that operate in discrete modes. For example, an autonomous vehicle has states like “Stopped,” “Moving,” “Parking,” and “Emergency Stop.” The State Machine Diagram defines exactly what events trigger a transition from one state to another. If the “Emergency Stop” button is pressed, the system must transition immediately, regardless of its current state.
Practitioners select this when the logic is driven by events rather than a linear sequence of steps. It is superior to Activity Diagrams for modeling control loops and state-dependent behavior.
📋 Requirements: Linking Needs to Design
The Requirement Diagram is not a structural or behavioral diagram, but a distinct category essential for traceability.
- Primary Function: Defines the needs and constraints of the system.
- Best Used For: Managing requirements, traceability, and verification.
- Key Elements: Requirements, elements, and relationships.
Every SysML model should have a Requirement Diagram. It serves as the source of truth for what the system must achieve. By linking requirements to blocks, activities, or other elements, engineers ensure that every design decision can be traced back to a specific need.
Without this diagram, verification becomes a guessing game. You cannot prove that the system meets the customer’s needs if those needs are not explicitly modeled and linked.
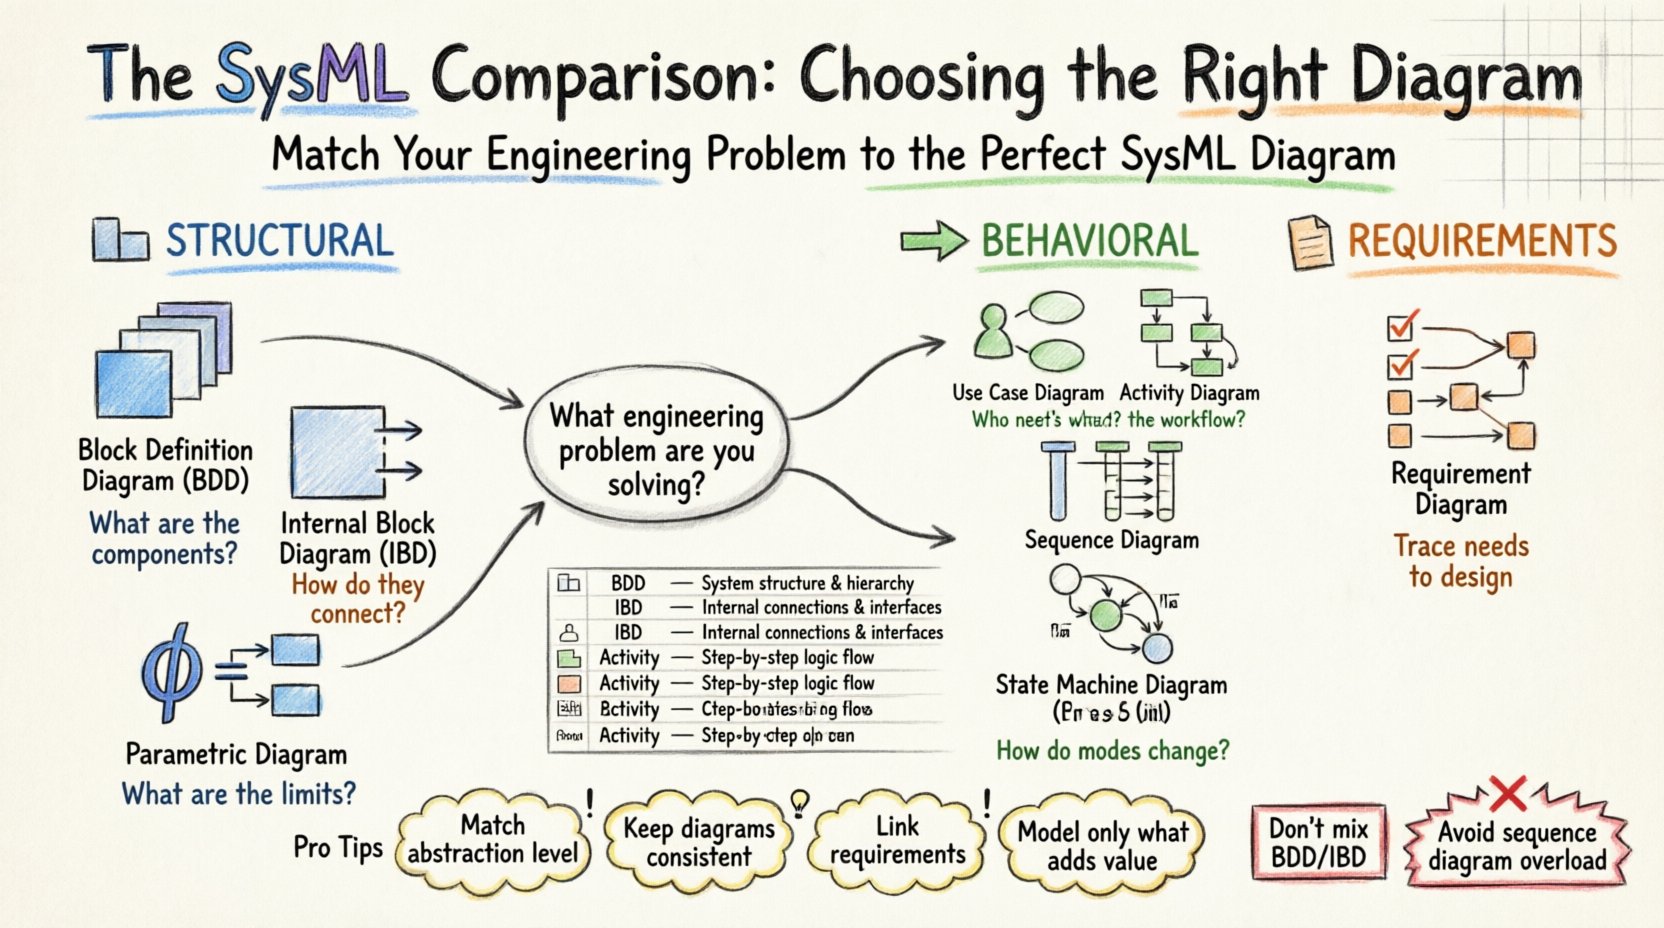
📊 Comparison Table: Mapping Problems to Models
To assist in decision-making, the following table summarizes the optimal diagram choices based on common engineering problems.
| Problem Scenario | Recommended Diagram Type | Why? |
|---|---|---|
| How is the system composed? | Block Definition Diagram (BDD) | Defines hierarchy and types. |
| How do components connect physically? | Internal Block Diagram (IBD) | Shows ports and flows. |
| What are the performance limits? | Parametric Diagram | Links math to structure. |
| What functions does the user need? | Use Case Diagram | Focuses on value and scope. |
| What is the step-by-step process? | Activity Diagram | Models workflow and logic. |
| How do objects interact over time? | Sequence Diagram | Visualizes message timing. |
| How does the system change modes? | State Machine Diagram | Models states and transitions. |
| What are the constraints? | Requirement Diagram | Establishes traceability. |
🧭 Strategies for Selection and Consistency
Selecting the right diagram requires discipline. A common mistake is creating too many diagrams of the same type, leading to redundancy and confusion. The following strategies help maintain clarity.
- Level of Abstraction: Keep high-level diagrams for stakeholders and detailed diagrams for engineers. A BDD at the system level should not contain the same detail as a BDD at the subsystem level.
- Consistency: Ensure that blocks in the IBD match the definitions in the BDD. If a block is renamed in the BDD, all references in the IBD and Behavioral diagrams must update.
- Traceability: Always link requirements to the diagrams that implement them. This creates a clear path from the “Why” to the “How.”
- Minimal Viable Model: Do not model everything. Only create diagrams that add value to the current problem. If a diagram does not help solve a specific engineering question, reconsider its necessity.
⚠️ Common Pitfalls in Model Construction
Avoiding errors is as important as creating correct models. Here are common issues encountered when selecting and using SysML diagrams.
- Confusing BDD and IBD: Do not put flow properties on a BDD. BDDs are for types; IBDs are for connections. Mixing them creates ambiguity.
- Overusing Sequence Diagrams: Sequence diagrams can become cluttered quickly. Use them for specific interaction points, not for the entire system behavior.
- Ignoring State Logic: Relying solely on Activity Diagrams for control logic can lead to complex spaghetti-like flows. Use State Machine Diagrams for discrete modes.
- Disconnected Requirements: Creating a Requirement Diagram without linking it to design elements renders it useless for verification.
🔗 Integration and Consistency
The power of SysML lies in the integration of these diagrams. They are not silos; they are views of the same model. A change in one diagram should propagate to others where applicable.
For example, if a new requirement is added to the Requirement Diagram, the engineer must verify if the BDD needs a new block, if the Activity Diagram needs a new action, or if the State Machine needs a new transition. This cross-referencing ensures the model remains coherent.
When practitioners maintain this integration, the model becomes a single source of truth. It reduces the likelihood of documentation drift, where the design no longer matches the requirements.
🔧 Final Thoughts on Diagram Selection
Choosing the right SysML diagram is a skill developed through experience and deliberate practice. It requires understanding the specific engineering question at hand and matching it to the appropriate modeling notation.
By distinguishing between structural definitions, behavioral flows, and mathematical constraints, engineers can build models that are both informative and actionable. The goal is not to create a massive repository of diagrams, but to create a focused set of views that solve specific problems.
Remember that the diagram is a tool for communication. If a diagram does not help the team understand the system better, it may not be the right tool. Continuously evaluate the necessity of each view. Focus on clarity, traceability, and consistency. This approach leads to robust system designs and more successful engineering outcomes.
As you build your models, keep the problem in mind first, and the diagram second. Let the requirements drive the structure, and the structure drive the behavior. This hierarchy ensures that the SysML model remains aligned with the system’s purpose.