


In the landscape of Model-Based Systems Engineering (MBSE), clarity is the currency of success. One of the most frequent points of confusion for newcomers to Systems Modeling Language (SysML) is the distinction between Activity Diagrams and Sequence Diagrams. Both diagrams describe behavior, yet they approach the problem from fundamentally different angles. Understanding when to deploy each tool is critical for building robust, maintainable system models.
This guide provides a deep dive into these two behavioral diagrams. We will explore their notation, their semantic meaning, and the specific contexts where one outperforms the other. By the end, you will have a clear framework for selecting the right diagram for your engineering needs.
Understanding Behavior in SysML 🛠️
Before distinguishing between specific diagram types, we must understand what SysML models. SysML is designed to capture requirements, structure, behavior, and constraints. Behavior is often the most abstract of these. It answers the question: “What does the system do?” and “How does it do it?”
Behavior in SysML is not just a list of functions. It is a representation of the dynamic aspects of a system over time or across states. To model this, SysML provides several diagram types. Among them, the Activity Diagram and the Sequence Diagram are the most prominent for describing operational logic. They are not interchangeable, though they often complement each other.
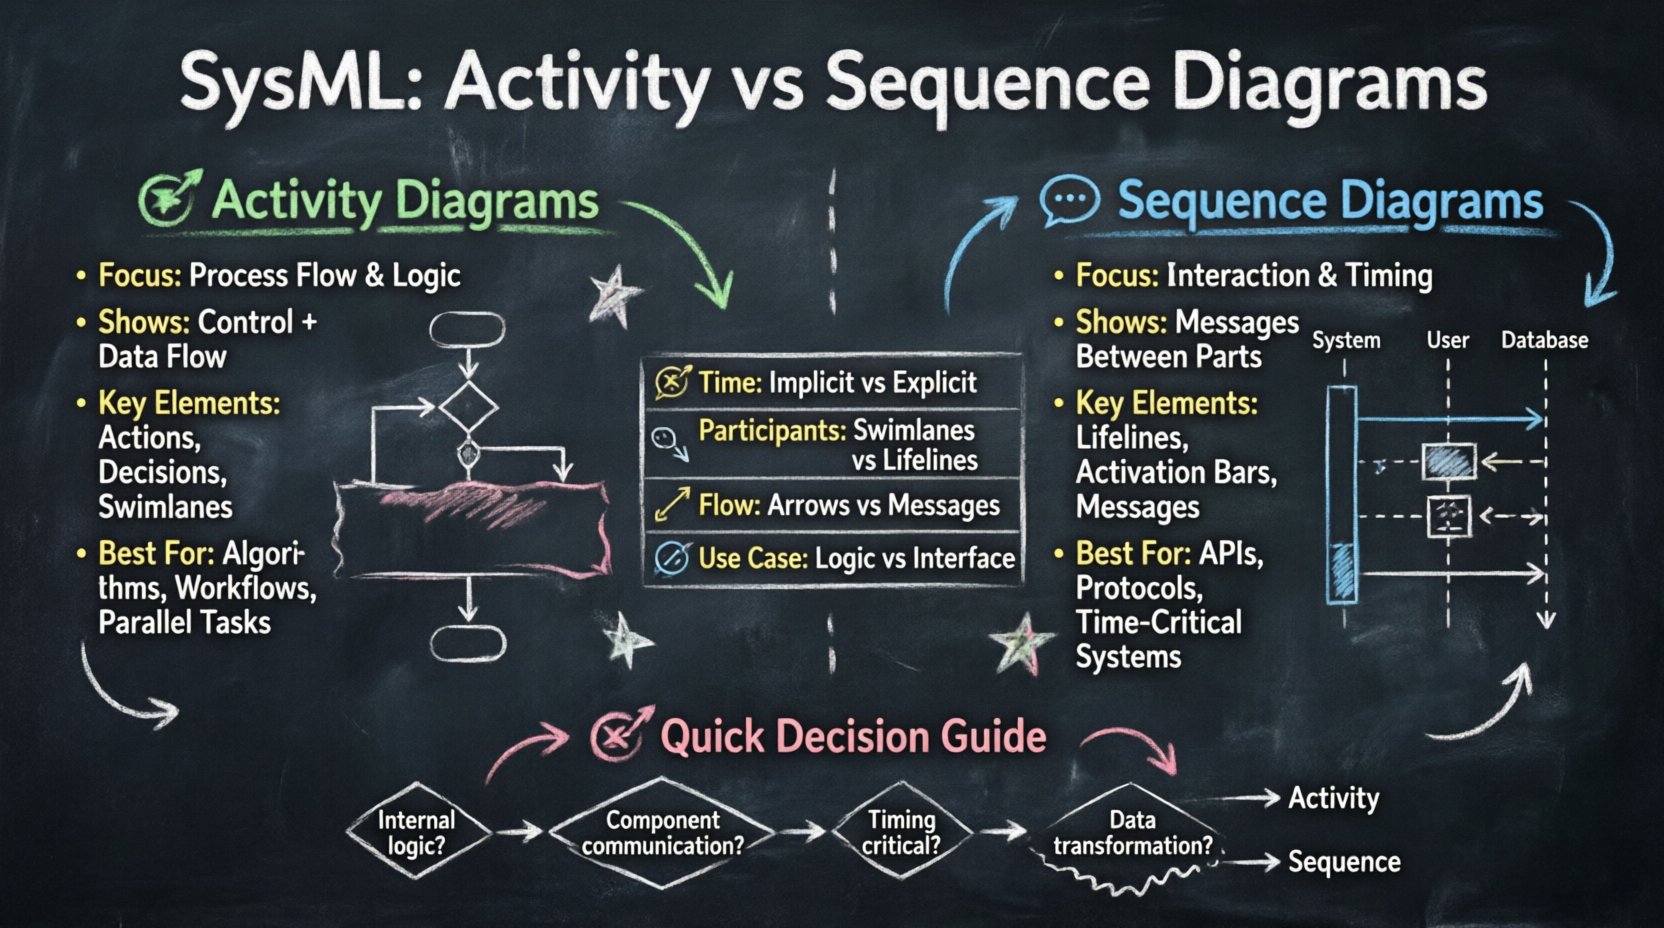
- Activity Diagrams focus on the flow of control and data through a process.
- Sequence Diagrams focus on the interaction between parts over a timeline.
Activity Diagrams: The Process Flow 🔄
The Activity Diagram is the workhorse of SysML behavior modeling. It is heavily borrowed from UML but adapted for systems engineering. Its primary purpose is to model the functional flow of a system or a subsystem. It is essentially a flowchart enhanced with system engineering semantics.
Core Components and Notation 📝
An Activity Diagram is composed of several key elements that define how work moves through the system:
- Initial Node: A solid black circle indicating where the flow begins. There should be exactly one initial node per activity.
- Activity State: A rounded rectangle representing a specific step or action within the process. This is where the “work” happens.
- Control Flow: A directed arrow showing the sequence of steps. It dictates the order of execution.
- Object Flow: A dashed arrow indicating the movement of data or material. This is crucial for tracking inputs and outputs between actions.
- Junctions: Diamond shapes used to merge or split flows. They handle decision points and parallel branches.
- Swimlanes: Horizontal or vertical partitions that group activities based on responsibility (e.g., “Software,” “Mechanical,” “Operator”).
When to Use an Activity Diagram 🎯
Activity Diagrams excel when the primary concern is the logic of a process. You should reach for this diagram when:
- You need to describe a complex algorithm or decision tree.
- You want to visualize the flow of data or material through a system.
- You are defining the workflow for a specific use case or mission scenario.
- Parallelism is a key feature of the process (e.g., concurrent processing streams).
- You need to show the responsibilities of different stakeholders via swimlanes.
For example, consider a landing gear system. An Activity Diagram would clearly show the sequence of events: “Extend Gear” -> “Check Position” -> “If Locked, Indicate OK” -> “If Not Locked, Retry.” The control flow dictates the order, while object flows might show hydraulic pressure signals moving between the pump and the valve.
Sequence Diagrams: The Interaction Timeline 💬
While Activity Diagrams focus on the process, Sequence Diagrams focus on the interaction. They model how system parts communicate with each other to achieve a goal. The defining characteristic of a Sequence Diagram is the explicit representation of time.
Core Components and Notation 📝
Sequence Diagrams rely on a different set of visual elements to convey timing and communication:
- Lifelines: Vertical dashed lines representing a participant (object, component, or actor) in the interaction. Each lifeline has a name at the top.
- Activation Bars: Rectangles on a lifeline indicating when the participant is active or executing an operation.
- Messages: Horizontal arrows between lifelines representing calls, signals, or returns. They are the core mechanism of interaction.
- Combined Fragments: Boxes with labels like alt (alternative), opt (optional), or par (parallel) to handle logic within the sequence.
- Time Axis: The vertical direction represents the passage of time. Events lower down the diagram occur later.
When to Use a Sequence Diagram 🎯
Sequence Diagrams are the choice when the primary concern is interface and timing. You should use this diagram when:
- You need to define the API or interface between two subsystems.
- Timing constraints are critical (e.g., response time, latency).
- You are modeling a specific message exchange protocol.
- You need to show the lifecycle of an object within a specific scenario.
- You are validating the interaction sequence against a requirement.
Returning to the landing gear example, a Sequence Diagram would focus on the exchange of signals. It would show the “Command Module” sending a “Extend” message to the “Hydraulic Controller,” which then activates the “Valve.” It would explicitly show the delay between the command and the hydraulic pressure reaching the actuator. This temporal detail is difficult to capture in an Activity Diagram.
Key Differences at a Glance 📊
To solidify the distinction, we can compare the two diagrams across several dimensions. This table highlights the structural and semantic differences.
| Feature | Activity Diagram | Sequence Diagram |
|---|---|---|
| Primary Focus | Control and Data Flow | Interaction and Timing |
| Time Representation | Implicit (Order of nodes) | Explicit (Vertical axis) |
| Participants | Swimlanes or Actions | Lifelines |
| Flow Mechanism | Control Flow / Object Flow | Messages (Calls/Signals) |
| Parallelism | Split/Merge Nodes | Parallel Lifelines / par Fragment |
| Best For | Process Logic, Algorithms | Interface Contracts, Protocols |
Decision Guide: Which Diagram to Choose? 🧭
Selecting the right diagram is not about preference; it is about fidelity to the system reality. Use the following decision matrix to guide your modeling efforts.
- Ask: Is the focus on the internal logic of a function?
If yes, use an Activity Diagram. If the function involves branching logic, loops, or complex data transformations, the Activity Diagram provides the necessary granularity. - Ask: Is the focus on communication between distinct parts?
If yes, use a Sequence Diagram. If the system behavior is defined by how Part A talks to Part B, the Sequence Diagram clarifies the interface. - Ask: Are timing constraints critical?
If the system must respond within X milliseconds, a Sequence Diagram is essential to visualize the latency and processing time. - Ask: Do I need to track material or data flow?
Activity Diagrams are superior for tracking the physical or digital movement of resources (Object Flow). Sequence Diagrams track information, not necessarily material.
It is common to use both. A high-level Activity Diagram might define the mission flow, while a Sequence Diagram drills down into a specific interaction within that flow. This hierarchical approach prevents cognitive overload and maintains model clarity.
Frequently Asked Questions (Q&A) ❓
To further clarify nuances, here are answers to common questions encountered during SysML modeling.
Q1: Can I replace an Activity Diagram with a Sequence Diagram?
In some simple cases, yes. If a process involves only two components exchanging a single message, a Sequence Diagram can suffice. However, as complexity grows, the Sequence Diagram becomes cluttered with lifelines. An Activity Diagram scales better for complex internal logic. Replacing one with the other often results in a loss of information regarding control flow or timing.
Q2: Do the diagrams need to be perfectly consistent?
Yes, consistency is vital for MBSE integrity. If an Activity Diagram shows a “Check Sensor” step, the Sequence Diagram representing that step must show the message sent to the sensor. Inconsistencies lead to ambiguity during implementation and testing. You should maintain a traceability link between the steps in the Activity Diagram and the interactions in the Sequence Diagram.
Q3: How do I model parallel processing in SysML?
In an Activity Diagram, use a Split Node to create multiple concurrent flows and a Fork Node to synchronize them back together. In a Sequence Diagram, use the par combined fragment to indicate that messages are sent simultaneously across different lifelines. The visual representation differs, but the logical intent is the same.
Q4: What is the role of the Internal Block Diagram (IBD) here?
The Internal Block Diagram defines the structure. It shows the ports and connectors. The Sequence Diagram uses the ports defined in the IBD as the endpoints for messages. The Activity Diagram uses the parts defined in the IBD as the swimlanes or the objects performing actions. You cannot effectively build a Sequence or Activity diagram without first defining the structure in an IBD.
Q5: Can Sequence Diagrams show data flow?
Not directly in the same way as Activity Diagrams. Sequence Diagrams show messages, which contain data. However, they do not explicitly show the transformation of data. If you need to show that data is being modified (e.g., “Calculate Value” -> “Store Value”), an Activity Diagram is more appropriate. Sequence Diagrams assume the message carries the payload, but they do not model the payload’s internal transformation.
Q6: Which diagram is better for requirements verification?
It depends on the requirement type. If the requirement is behavioral (“The system shall cycle through modes…”), an Activity Diagram is often better to verify the state transitions. If the requirement is interface-based (“The system shall send a signal within 100ms…”), a Sequence Diagram is the primary verification tool.
Best Practices for Clarity ✨
To ensure your models remain readable and useful over the lifecycle of the project, adhere to these best practices.
- Limit Scope: Do not attempt to model the entire system in a single diagram. Break down activities into sub-activities. Break down sequences into specific scenarios.
- Use Swimlanes Sparingly: In Activity Diagrams, too many swimlanes create a “spaghetti chart.” Group by subsystem or stakeholder, not by individual component if the system is large.
- Label Messages Clearly: In Sequence Diagrams, name messages after the action they trigger. Avoid generic names like “Send Data.” Use “Send Telemetry” or “Request Calibration” instead.
- Maintain Traceability: Link diagram elements to Requirements. If an Activity Node is linked to a Requirement, ensure the corresponding Sequence Message is also linked. This creates a complete verification path.
- Consistent Notation: Stick to one standard for notation (e.g., SysML 1.5 or 1.6). Do not mix UML and SysML notations arbitrarily unless necessary for legacy compatibility.
Integrating Behavior with Structure 🔗
Behavior diagrams do not exist in a vacuum. They must be grounded in the system structure. The Block Definition Diagram (BDD) and Internal Block Diagram (IBD) provide the context.
When creating an Activity Diagram, the actions should correspond to operations defined on the blocks in your BDD. If you have an action named “Start Engine,” there should be a corresponding operation on the “Engine Block” in your structure diagrams. This alignment ensures that the behavior model is executable and traceable to the physical design.
Similarly, the lifelines in a Sequence Diagram should correspond to instances of the blocks defined in the IBD. This ensures that the interaction logic maps directly to the physical interfaces. Without this integration, the behavior model becomes a theoretical exercise rather than an engineering artifact.
Avoiding Common Pitfalls ⚠️
Even experienced modelers can fall into traps. Be vigilant against these common issues.
- Overlapping Concerns: Do not mix control flow and data flow in a confusing way. If you have complex data transformations, consider a dedicated Data Flow Diagram or ensure the Object Flows are clearly distinct from Control Flows.
- Ignoring Time: Activity Diagrams are generally untimed. Do not assume they represent real-time execution unless you add specific timing constraints. Use Sequence Diagrams for temporal validation.
- Too Many Lifelines: A Sequence Diagram with more than five lifelines is often unreadable. Group interactions or use sub-sequences to manage complexity.
- Missing Error Handling: Both diagram types often focus on the “Happy Path.” Ensure you model failure scenarios using alt fragments in Sequence Diagrams and decision nodes in Activity Diagrams.
Summary of Key Takeaways 📌
Selecting between Activity and Sequence Diagrams is a strategic decision based on the nature of the information you need to convey. Activity Diagrams map the logic and flow of a process, making them ideal for internal system behavior and data transformation. Sequence Diagrams map the interaction and timing between components, making them ideal for interface definition and protocol verification.
By understanding the strengths and limitations of each, you can build a SysML model that is not only accurate but also effective for communication across the engineering team. Use Activity Diagrams to define the “How” of the process, and Sequence Diagrams to define the “When” and “Who” of the interaction. Combining them with a solid structural foundation creates a comprehensive MBSE model that stands the test of time.
Remember that modeling is an iterative process. You may start with an Activity Diagram to understand the flow, and then refine the interactions using Sequence Diagrams as the design matures. This flexibility is a key advantage of the SysML standard.