


Introduction
In modern Agile development, clear communication of data structures is just as critical as the code itself. While traditional drag-and-drop diagramming tools are common, “Diagram-as-Code” approaches offer version control, rapid iteration, and seamless integration into developer workflows. Visual Paradigm’s VPasCode bridges this gap, allowing developers to generate complex diagrams directly from text.
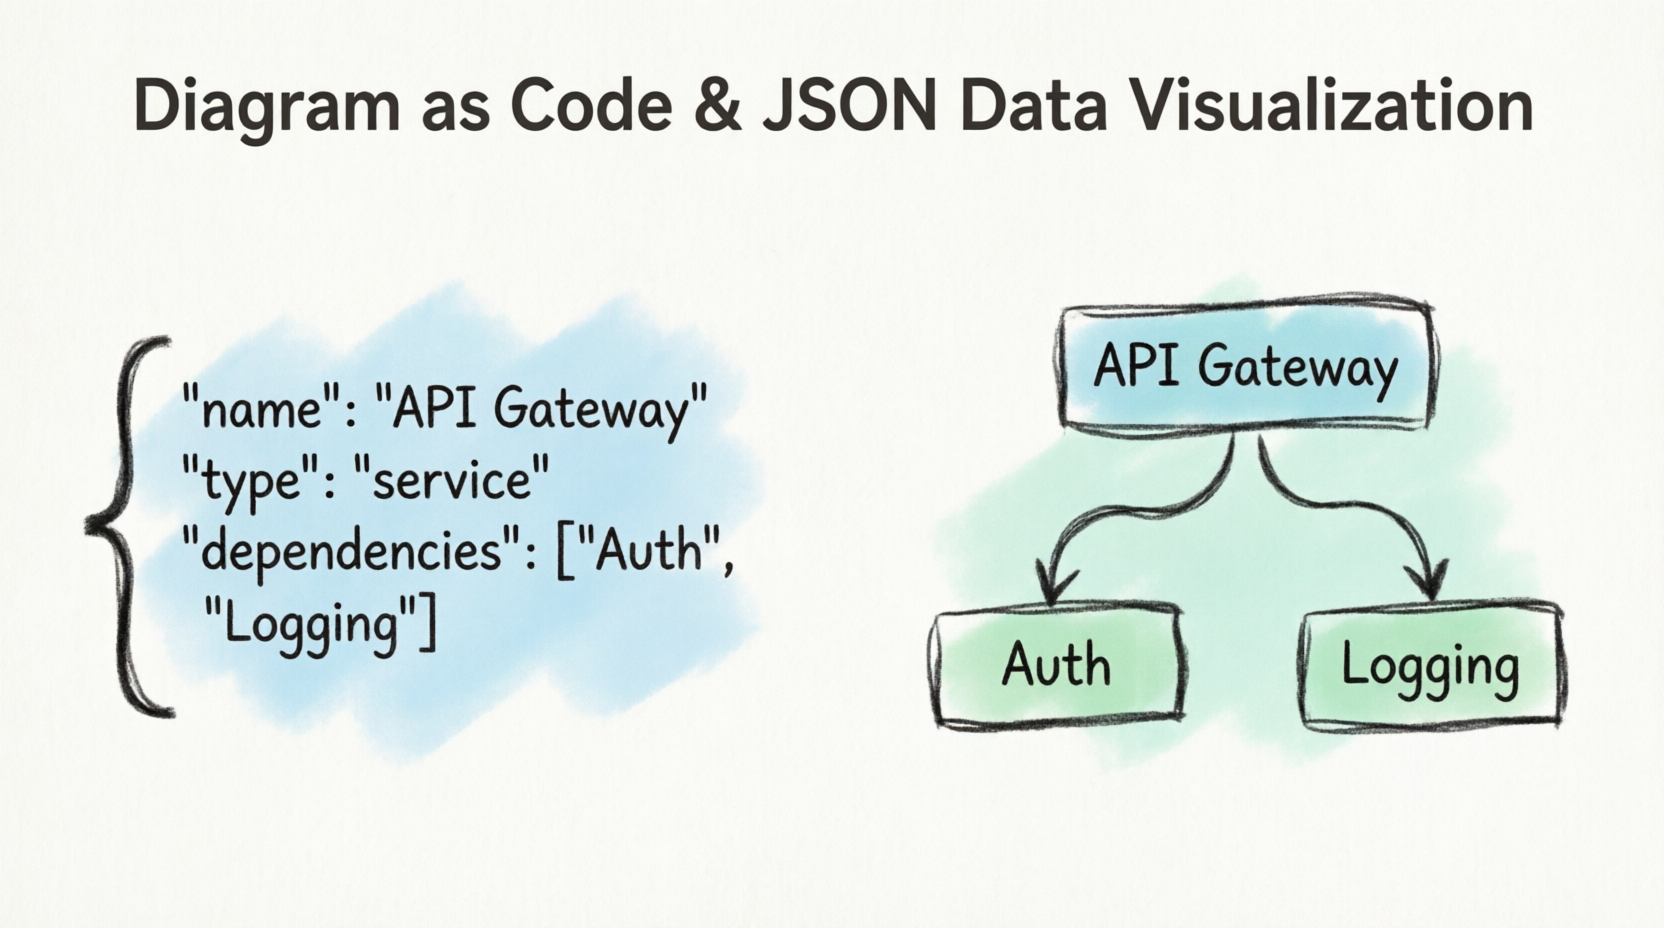
One of its most powerful features is the ability to render PlantUML JSON diagrams. This capability simplifies data structure modeling, making it easier for Agile teams to visualize API payloads, configuration files, and database schemas. This comprehensive guide will walk you through setting up VPasCode, writing JSON data, and understanding how PlantUML translates your raw data into clear, visual maps.
1. Enable VPasCode in Visual Paradigm
To start writing diagrams as code, you must first activate the diagramming editor within your Visual Paradigm environment.
-
Open Visual Paradigm.
-
Navigate to the Modeling tab located in the top menu bar.
-
Click on Diagram as Code (VPasCode).
-
Open a new workspace canvas to begin your script.
2. Create a PlantUML JSON Diagram
VPasCode is highly versatile and supports multiple textual syntax formats, including PlantUML, Mermaid, and others. For data modeling, we will focus on PlantUML.
-
In the editor panel, select PlantUML as your active syntax language.
-
Create a new blank diagram script.
-
Type
@startjsonon the first line to initialize the data block. -
Type
@endjsonat the bottom of your script to close the data block.
3. Write and Visualize the JSON Data
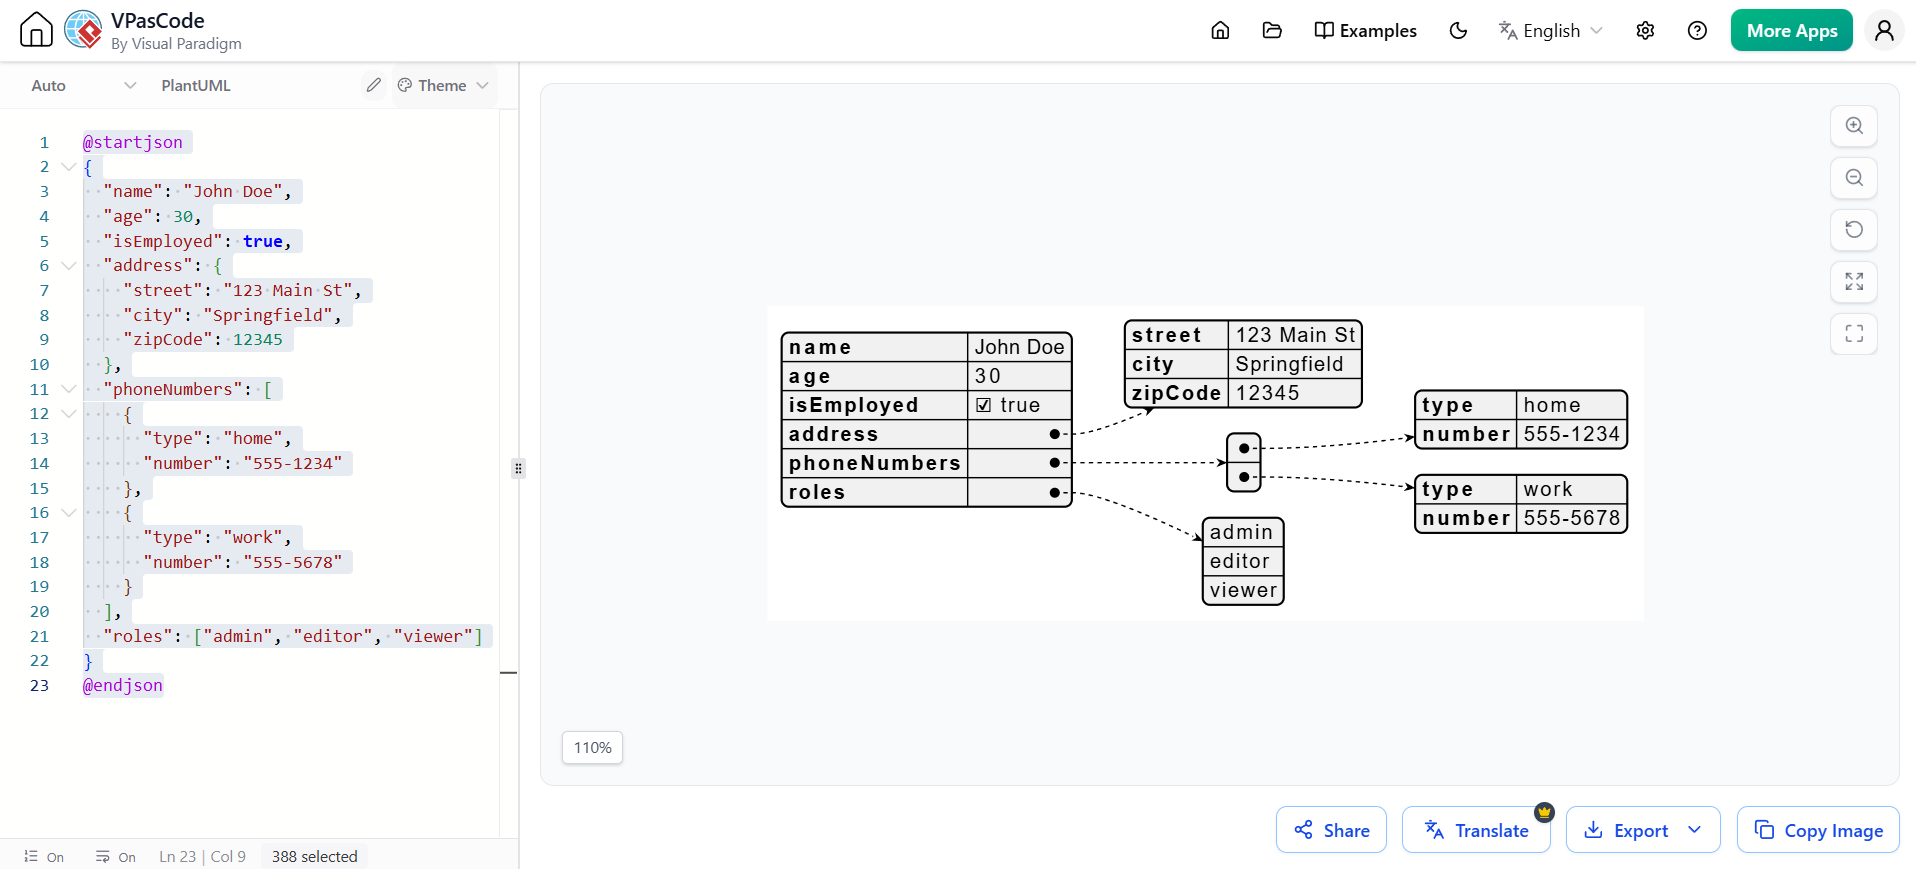
Insert your structured JSON data between the initialization tags. The VPasCode editor will automatically parse the key-value pairs, nested objects, and arrays into a clear, tree-like visual map.
Paste the following script into your VPasCode editor pane:
@startjson
{
  "name": "John Doe",
  "age": 30,
  "isEmployed": true,
  "address": {
    "street": "123 Main St",
    "city": "Springfield",
    "zipCode": 12345
  },
  "phoneNumbers": [
    {
      "type": "home",
      "number": "555-1234"
    },
    {
      "type": "work",
      "number": "555-5678"
    }
  ],
  "roles": ["admin", "editor", "viewer"]
}
@endjson
Rendering the Diagram
-
Click the Refresh or Preview button in the tool.
-
The application will instantly render a graphical chart.
-
Key-value rows represent direct object parameters in neat tabular formats.
-
Nested brackets expand into separate sub-tables, connected by structural lines.
-
Horizontal connection arrows map out complex arrays, visually linking related data points.
4. Core PlantUML JSON Concepts
Understanding how PlantUML interprets JSON primitives is essential for constructing cleaner, more readable structural diagrams. Here is how the engine translates your code:
-
Root Object: Enclosed within outer curly braces
{ }, this forms the central starting node of your visualized tree. It acts as the anchor for all subsequent data. -
Key-Value Pairs: Formatted as
"string": value. Strings, numbers, and booleans display as neat tabular rows inside the node blocks, making primitive data highly readable at a glance. -
Nested Objects: Formatted as
"key": { ... }. PlantUML automatically draws a structural pointer line from the parent node to a new child node table, preserving the hierarchical relationship of the data. -
Arrays: Formatted as
"key": [ ... ]. Ordered lists display as stacked vertical index blocks (e.g.,0,1,2). This visually isolates individual array elements, making it easy to distinguish between multiple items in a list.
Conclusion
Integrating PlantUML JSON diagrams into your Visual Paradigm workflow via VPasCode fundamentally transforms how Agile teams visualize and communicate data structures. By treating diagrams as code, you eliminate the friction of manual drawing, ensure your documentation stays perfectly in sync with your actual data models, and leverage the intuitive, tree-like visualizations that PlantUML provides.
Whether you are mapping out complex API payloads, configuring microservices, or designing NoSQL database schemas, VPasCode empowers you to turn raw JSON into actionable visual insights in seconds. Embrace the Diagram-as-Code methodology, streamline your data modeling process, and keep your team aligned with clear, automatically generated visual documentation.
Reference
-
Case Study: Accelerating Software Architecture Documentation with VPasCode – A Diagram-as-Code Revolution: A case study on how VPasCode bridges the gap between code and visualization through AI-ready Diagram-as-Code and automated layout engineering.
-
Comprehensive Guide to VPasCode by Visual Paradigm: A detailed overview of VPasCode’s core philosophy, user interface, multi-engine support, and collaboration workflows.
-
From Code to Clarity: A Beginner’s Guide to Seamless Diagramming with VPasCode and OpenDocs: A tutorial on using VPasCode with OpenDocs for AI-powered documentation, including practical PlantUML examples and pipeline integration.
-
Mastering VPasCode: The Ultimate Guide to AI-Powered Diagram-as-Code with Multi-Engine Support: An advanced guide covering VPasCode’s unique advantages, AI-native architecture, and multi-engine support.
-
Revolutionizing Diagram Maintenance: How VPasCode’s AI Auto-Fix Eliminates Syntax Frustrations: An in-depth look at VPasCode’s AI-driven auto-fix feature for automatic detection and correction of syntax errors.
-
How the Visual Paradigm AI Chatbot and VPasCode function as an integrated ecosystem for diagramming: Explains the integrated two-phase workflow combining the AI Chatbot for rapid generation and VPasCode for precise diagram refinement.
-
Clarity by Design: Streamlining Infrastructure Documentation with VPasCode and Graphviz: A case study on using VPasCode and Graphviz DOT language for modernizing infrastructure documentation as code.
-
VPasCode: Unified Diagram-as-Code Platform: Official feature page detailing supported diagram types, multi-engine support, real-time preview, and export capabilities.