


Strategic planning requires more than a simple list of external factors. While the standard PEST analysis provides a foundational view of the macro-environment, it often treats all factors with equal importance. This creates noise rather than signal. The Weighted PEST Method refines this process by introducing quantification, ensuring that organizations focus resources on the factors that truly drive success or pose significant threats.
This guide details the mechanics of implementing a weighted approach. We will move beyond basic identification to scoring, calculation, and actionable strategy. By applying mathematical rigor to qualitative data, decision-makers gain a clearer picture of where to direct attention.
🧩 What is Standard PEST Analysis?
Before optimizing the method, it is necessary to understand the baseline. PEST stands for Political, Economic, Social, and Technological. It is a framework used to scan the external environment of an organization.
- Political: Government policies, trade restrictions, tax laws, and stability.
- Economic: Growth rates, inflation, exchange rates, and interest rates.
- Social: Demographics, cultural trends, health consciousness, and lifestyle changes.
- Technological: R&D activity, automation, and rate of technological change.
In a traditional session, teams brainstorm these categories. A list of ten items might be generated for each category. However, without a mechanism to prioritize, the output is a flat list. Every item appears equally relevant. This dilutes the effectiveness of the strategic plan.
⚠️ The Limitation of Standard PEST
The primary weakness of the standard model is the assumption of uniform impact. Consider a scenario where an organization operates in a volatile market.
- Factor A: A minor change in a local zoning law.
- Factor B: A global shift in energy pricing.
In a standard PEST, both factors receive the same space on the page. Yet, Factor B will likely dictate the financial future of the company, while Factor A might be negligible. Without weighting, teams struggle to distinguish between noise and critical signals. This leads to resource misallocation.
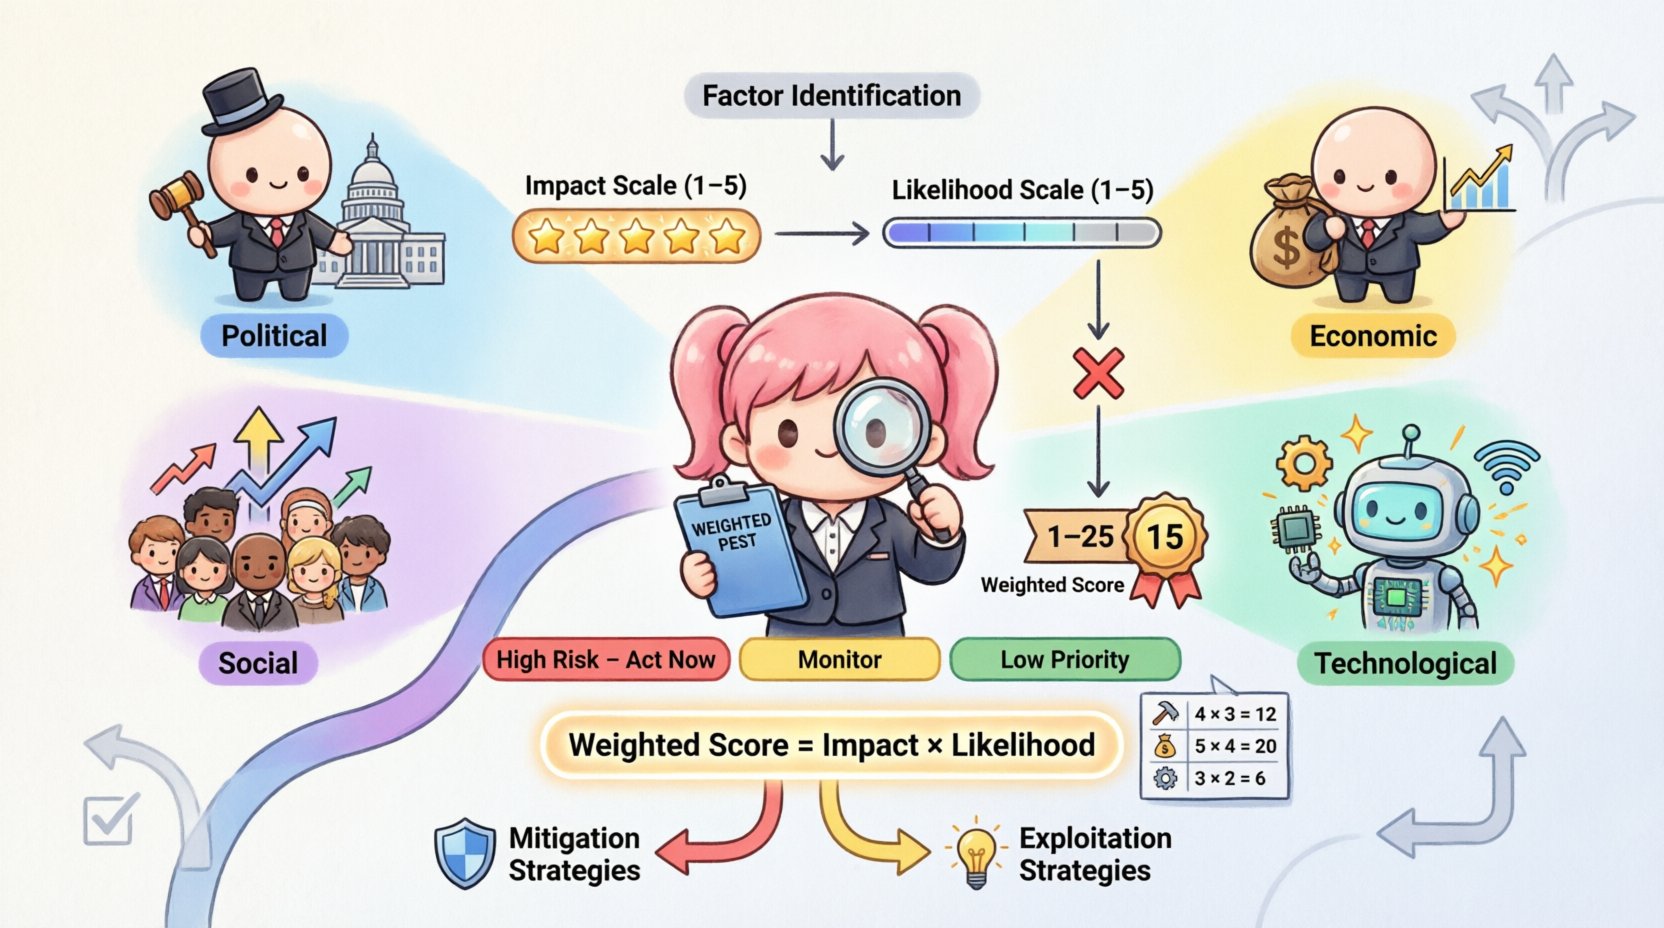
🎯 Introducing the Weighted Approach
The Weighted PEST Method assigns a score to each identified factor based on two criteria:
- Impact: How much will this factor affect the organization if it changes?
- Likelihood: How probable is it that this factor will change or occur?
By multiplying these values, we derive a weighted score. This score dictates the priority of the factor in the strategic plan. High-scoring factors demand immediate attention and contingency planning. Low-scoring factors may be monitored but do not require immediate resource allocation.
🛠️ Step-by-Step Implementation Guide
Implementing this method requires a structured workshop or analysis session. Follow these steps to ensure accuracy and buy-in.
Step 1: Identification and Brainstorming
Gather a cross-functional team. The goal is to identify external factors across the four PEST categories. Do not stop at generalities. Specificity yields better data.
- Bad Example: “Economy might grow.”
- Good Example: “Interest rates may rise by 2% in Q3 due to central bank policy.”
Aim for 10 to 20 factors per category. Quality matters more than quantity. If a factor is vague, it cannot be scored accurately.
Step 2: Define Scoring Criteria
Before scoring, agree on what the numbers mean. Use a scale of 1 to 5 for both Impact and Likelihood.
Impact Scale:
- 1 (Low): Minimal effect on operations or revenue.
- 2 (Medium-Low): Noticeable effect, but manageable with existing resources.
- 3 (Medium): Significant effect requiring some adjustment to strategy.
- 4 (Medium-High): Major shift required in operations or budget.
- 5 (High): Existential threat or massive opportunity. Changes business model viability.
Likelihood Scale:
- 1 (Very Unlikely): Less than 10% chance of occurring.
- 2 (Unlikely): 10% to 30% chance.
- 3 (Possible): 30% to 50% chance.
- 4 (Likely): 50% to 70% chance.
- 5 (Certain): Greater than 70% chance.
Step 3: The Scoring Matrix
Once factors are identified, the team scores them. Use a consensus-based approach. If there is disagreement, discuss the reasoning until alignment is reached. Record the scores in a structured format.
Below is a sample table structure for recording these factors.
| Category | Factor Description | Impact (1-5) | Likelihood (1-5) | Weighted Score |
|---|---|---|---|---|
| Political | New data privacy regulations | 4 | 4 | 16 |
| Economic | Inflation rate increase | 3 | 5 | 15 |
| Social | Shift to remote work | 2 | 5 | 10 |
| Technological | AI adoption in logistics | 5 | 3 | 15 |
Notice how the scores differ. The Political factor and Technological factor both score 15, but they represent different types of risk. This clarity allows for targeted planning.
Step 4: Calculating the Scores
The calculation is straightforward arithmetic. Multiply the Impact score by the Likelihood score.
Formula: Weighted Score = Impact × Likelihood
The maximum possible score is 25 (5 × 5). The minimum is 1 (1 × 1). Factors scoring 15 or higher typically require immediate strategic action. Factors scoring between 5 and 10 should be monitored. Factors below 5 can often be deprioritized.
Step 5: Strategic Action Planning
Rank the factors by their weighted score. The top factors become the focus of the strategic plan. For each high-scoring factor, develop a specific response.
- Threats: Develop mitigation strategies. How do we reduce the impact or lower the likelihood?
- Opportunities: Develop exploitation strategies. How do we maximize the benefit?
This step transforms the analysis from a report into an action plan. It ensures that the time spent on analysis translates into operational changes.
🌍 Deep Dive: Factors by Category
Applying the weighting system requires specific knowledge of each category. Below is a breakdown of common factors and how to evaluate them.
Political Factors 🏛️
Political stability and regulation are often high-impact. However, the likelihood varies by region.
- Example: Changes in import tariffs.
- Impact: High. Directly affects cost of goods sold.
- Likelihood: Variable. Depends on election cycles and trade agreements.
- Weighting Logic: If a country is politically stable, the likelihood of sudden policy shifts is low, reducing the weighted score even if the impact is high. Conversely, in unstable regions, the likelihood is higher, pushing the score up significantly.
Economic Factors 💰
Economic indicators are often leading indicators. They are easy to track but hard to control.
- Example: Currency exchange volatility.
- Impact: Medium to High. Affects profitability for import/export businesses.
- Likelihood: High. Currency fluctuates constantly.
- Weighting Logic: Even if the impact is moderate, a high likelihood can push the weighted score high, necessitating hedging strategies or pricing adjustments.
Social Factors 👥
Social trends move slowly but create long-term shifts. They are often underestimated in terms of speed.
- Example: Aging population demographics.
- Impact: High. Changes labor supply and consumer demand.
- Likelihood: Very High. Demographics are predictable over the next decade.
- Weighting Logic: Because the likelihood is near certainty, the weighted score relies heavily on the impact. If the demographic shift affects your core product, the score will be maximum.
Technological Factors 💻
Technology evolves rapidly. The risk of obsolescence is real.
- Example: Disruptive automation technology.
- Impact: High. Can render current assets useless.
- Likelihood: Medium. Adoption rates vary by industry.
- Weighting Logic: If your industry is slow to adopt tech, the likelihood might be lower. If you are in tech, the likelihood is high. Weighting helps distinguish between hype and genuine disruption.
⚖️ Interpreting the Results
Once the scores are calculated, they tell a story. The distribution of scores reveals the risk profile of the organization.
The High-Risk Zone (Scores 20-25)
These factors are critical. They represent scenarios where the organization is highly exposed to change. Strategic focus must be on resilience. Diversification, insurance, or contingency budgeting are common responses.
The Monitoring Zone (Scores 10-19)
These factors are significant but not immediate. They require ongoing surveillance. Set triggers that, when hit, move these factors into the High-Risk Zone. For example, if a likelihood score jumps from 3 to 4, the weighted score doubles, triggering a review.
The Low Priority Zone (Scores 1-9)
These factors are noise. They do not warrant deep strategic planning. However, do not ignore them completely. A low score today does not guarantee a low score tomorrow. Keep them on a watch list.
🚫 Common Pitfalls to Avoid
Even with a structured method, errors can occur. Awareness of these pitfalls improves the quality of the analysis.
- Confirmation Bias: Scoring factors based on what you want to happen rather than reality. Ensure data backs the likelihood scores.
- Static Analysis: Treating the analysis as a one-time event. The environment changes. Re-evaluate scores quarterly or annually.
- Subjective Consensus: If one senior leader dominates the scoring session, the data is skewed. Use anonymous scoring or independent reviews before averaging.
- Ignoring Interdependencies: Factors often influence each other. A political change might cause an economic shift. While the weighted method simplifies this, acknowledge that a high score in one category might amplify a score in another.
🔄 Integration with Other Frameworks
The Weighted PEST Method does not exist in a vacuum. It works best when integrated with internal analysis tools.
SWOT Analysis
Use the top weighted factors to feed into the “Opportunities” and “Threats” sections of a SWOT analysis. The weighting ensures that the SWOT focuses on the most relevant external drivers.
Scenario Planning
Take the highest weighted factors and build scenarios around them. What happens if the Likelihood score increases? What happens if the Impact score rises? This stress-testing strengthens the strategic plan.
Portfolio Management
When deciding which projects to fund, reference the Weighted PEST. Projects that mitigate high-scoring risks or capitalize on high-scoring opportunities should receive priority funding.
📈 Measuring Success
How do you know if the Weighted PEST Method is working? Look at the decision-making process.
- Speed: Are decisions made faster when external shocks occur? The pre-identified high-score factors allow for rapid response.
- Resource Allocation: Does budget go to the areas flagged as high risk? If resources remain on low-priority items, the weighting system needs refinement.
- Accuracy: Did the organization anticipate the top external changes? If the top weighted factors materialized, the analysis was accurate.
🔍 Practical Example: Retail Expansion
Consider a retail chain planning to expand into a new country. They apply the Weighted PEST Method.
Factor: Local labor laws.
- Impact: 4 (High operational complexity)
- Likelihood: 4 (High chance of new regulations during expansion)
- Score: 16
Factor: Local holiday shopping trends.
- Impact: 3 (Affects revenue timing)
- Likelihood: 5 (Known cultural fact)
- Score: 15
Factor: Competitor marketing budget.
- Impact: 3
- Likelihood: 2
- Score: 6
The expansion team focuses 80% of their planning energy on labor laws and shopping trends. The competitor budget is noted but does not drive the initial strategy. This focus ensures the launch is viable and compliant.
🤝 Team Dynamics and Facilitation
The success of this method relies heavily on the people involved. A facilitator should guide the session to ensure objectivity.
- Diverse Perspectives: Include finance, operations, sales, and legal. Each department sees different risks.
- Facilitator Role: The facilitator prevents groupthink. If everyone agrees on a score of 5 immediately, ask for dissenting views. Challenge the data sources.
- Documentation: Record the rationale for every score. Future teams need to know why a factor was weighted highly. This creates an audit trail for strategic decisions.
📉 Adjusting for Industry Context
Not all industries weigh the same. A tech startup might weigh Technological factors higher than a utility company.
- High-Tech: Technological impact is often 5. Political impact might be lower.
- Manufacturing: Economic and Political factors often dominate due to supply chain dependencies.
- Services: Social factors (consumer sentiment) often carry the highest weight.
Customize the scoring criteria to match industry volatility. In stable industries, the threshold for a “High Impact” score might be lower than in volatile industries.
🧠 Cognitive Biases in Scoring
Human judgment is prone to error. Be aware of specific biases during the scoring phase.
- Recency Bias: Overweighting recent events. A recent news story might make a factor seem more likely than it is historically.
- Optimism Bias: Underestimating risks because you want the project to succeed. Force the team to argue against the project to balance this.
- Anchoring: The first score suggested sets the tone for the rest. Start with a blank slate or use independent scoring before discussion.
📊 Visualizing the Data
Presenting the weighted data effectively aids communication. Use visual aids to show the distribution.
- Scatter Plot: Plot Likelihood on the X-axis and Impact on the Y-axis. High-score factors will cluster in the top-right quadrant.
- Heat Map: Color-code the PEST categories based on their average weighted score. Red indicates high aggregate risk.
- Radar Chart: Show the balance across the four categories. If one category is disproportionately weighted, it highlights a specific vulnerability.
🔮 Future-Proofing the Analysis
The external environment is dynamic. A Weighted PEST analysis today may not hold next year. Build flexibility into the process.
- Trigger Points: Define specific metrics that trigger a re-evaluation. For example, “If inflation hits 5%, re-score Economic factors.”
- Living Document: Keep the analysis in a shared format that allows updates. Do not print and file it away.
- Feedback Loops: After a strategic decision is made, review the outcome. Did the weighted score predict the result? If not, adjust the scoring criteria.
💡 Final Considerations
The Weighted PEST Method transforms a qualitative exercise into a quantitative tool. It forces discipline in thinking about the future. By acknowledging that not all external factors are equal, organizations can allocate capital and attention more effectively.
This approach does not eliminate uncertainty. The future remains unpredictable. However, it reduces the risk of surprise by systematically identifying where the greatest risks and opportunities lie. It provides a structured way to navigate complexity without getting lost in the details.
Start by identifying the factors. Then, apply the weights. Finally, act on the results. This cycle creates a continuous loop of strategic adaptation and clarity.