


Strategic planning is only as strong as the evidence supporting it. The PEST analysis framework—examining Political, Economic, Social, and Technological factors—serves as a foundational tool for organizations navigating complex macro-environments. However, the utility of this model depends entirely on the integrity of the underlying data. Too often, decision-makers accept readily available statistics without scrutiny, leading to flawed strategies and costly missteps.
This guide outlines the specific pitfalls encountered during PEST research and provides a rigorous methodology for verifying data sources. By prioritizing academic rigor and source validation, you ensure that strategic decisions are grounded in reality rather than assumption.
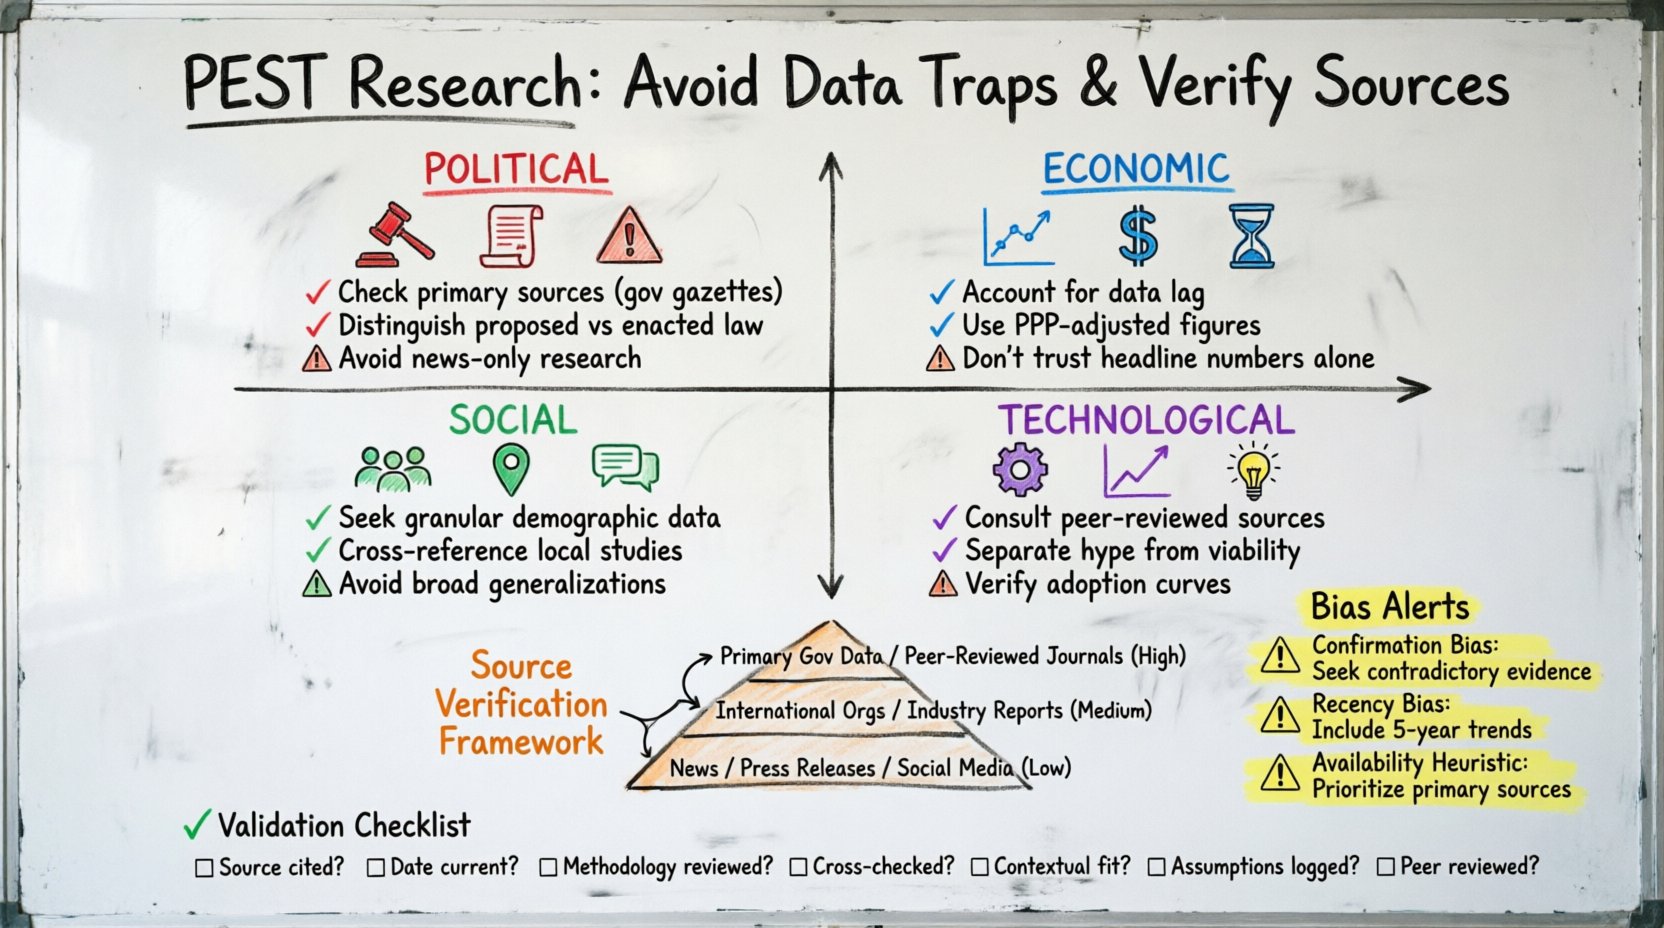
🧩 The Foundation of Reliable PEST Analysis
Before diving into verification, it is essential to understand the scope of the analysis. PEST analysis is not merely a list of observations; it is a structured assessment of external forces. The validity of the output rests on the input quality. When data is outdated, biased, or unverified, the resulting strategic direction becomes speculative.
To maintain integrity, researchers must approach data collection with skepticism. Even data from reputable organizations can be misinterpreted or lack context. The following sections detail the specific traps associated with each PEST category and how to mitigate them.
⚖️ Political & Economic Data Pitfalls
The Political and Economic quadrants of the PEST framework often rely on hard numbers and legislative records. While these seem objective, they are prone to significant distortion if not handled correctly.
1. The Lag Effect in Economic Indicators
Economic data is rarely instantaneous. Reports on Gross Domestic Product (GDP), inflation, and unemployment are typically released weeks or months after the period they cover. Relying on the most recent headline number without understanding the lag can misrepresent current conditions.
- Impact: Strategies based on lagging indicators may react too late to shifting market dynamics.
- Verification: Check the publication date against the data collection period. Look for preliminary estimates versus final revisions.
- Context: Consider seasonal adjustments. Raw numbers often require normalization to compare across quarters.
2. Political Stability and Regulatory Ambiguity
Political data often comes in the form of news reports or policy announcements. These sources can vary wildly in reliability depending on the political stance of the publisher. Furthermore, legislative changes can be ambiguous until implementation guidelines are published.
- Impact: Investing based on a policy promise that has not been codified into law carries high risk.
- Verification: Prioritize primary sources such as government gazettes, official parliamentary records, or regulatory agency filings.
- Context: Distinguish between proposed legislation and enacted law. Monitor the status of bills through official legislative trackers.
3. Currency Fluctuation and Purchasing Power
Economic comparisons across borders require careful handling of currency exchange rates. A static exchange rate does not account for purchasing power parity (PPP). Using nominal rates without adjustment can skew market size estimates.
- Impact: Overestimating market potential in emerging economies due to currency devaluation.
- Verification: Use PPP-adjusted data from international financial institutions for cross-border comparisons.
- Context: Analyze historical volatility. A currency that is stable today may not be stable in the next fiscal year.
🌍 Social & Technological Data Pitfalls
The Social and Technological factors are often more qualitative and harder to quantify. This ambiguity introduces different types of risks, particularly regarding cultural interpretation and technology adoption rates.
1. Demographic Generalizations
Population data is frequently aggregated into broad categories. Relying on these generalizations can obscure niche segments that are critical for specific product launches or market entry strategies.
- Impact: Targeting the wrong demographic segment leads to wasted marketing spend and low conversion rates.
- Verification: Seek granular data sets. Look for regional breakdowns rather than national averages.
- Context: Consider generational shifts. Data from ten years ago regarding digital literacy may not apply to current cohorts.
2. The Hype Cycle in Technology Assessment
Technological trends are often driven by media narratives that exaggerate adoption rates. The “hype cycle” can lead researchers to believe a technology is ready for mass implementation when it is still in the experimental phase.
- Impact: Premature investment in infrastructure or capabilities that lack market readiness.
- Verification: Consult peer-reviewed journals and industry adoption curves rather than trade press headlines.
- Context: Differentiate between technological capability and commercial viability. Just because a technology exists does not mean it is profitable.
3. Cultural Nuance and Social Norms
Social data often comes from surveys or focus groups that may not capture deep-seated cultural norms. Misinterpreting social signals can lead to brand positioning that resonates poorly with local populations.
- Impact: Marketing campaigns that inadvertently offend cultural sensibilities.
- Verification: Utilize ethnographic studies and local academic research. Cross-reference survey data with local news analysis.
- Context: Account for regional variations within a single country. National social trends often mask significant local differences.
🔍 A Framework for Source Verification
To navigate these traps, a structured verification process is required. This process moves from identifying the source to evaluating its credibility and finally cross-referencing the information.
1. Hierarchy of Source Reliability
Not all data sources are created equal. Establishing a hierarchy helps prioritize information during the research phase. The table below outlines the typical reliability scores associated with different source types.
| Source Type | Reliability Score | Typical Use Case |
|---|---|---|
| Primary Government Data | High | Legislation, Census, Tax Records |
| Peer-Reviewed Journals | High | Academic Studies, Market Theory |
| International Organizations | High | Global Economic Indicators, Health Data |
| Industry Reports (Paid) | Medium | Market Size, Competitor Analysis |
| News Outlets | Medium-Low | Timely Events, Policy Announcements |
| Corporate Press Releases | Low | Company Performance, Strategic Direction |
| Blogs / Social Media | Very Low | Public Sentiment, Anecdotal Evidence |
2. Cross-Referencing Methodology
Single-source verification is insufficient for high-stakes strategic planning. Cross-referencing ensures that information is not an outlier or an anomaly.
- Triangulation: Compare data from at least three independent sources. If two primary sources agree, the likelihood of accuracy increases significantly.
- Temporal Alignment: Ensure all data points used in a single analysis cover the same time period. Mixing data from 2020 with 2024 can create false correlations.
- Geographic Consistency: Verify that the geographic scope matches your analysis. National data should not be used to infer local market conditions without adjustment.
3. Author and Publisher Accountability
Understanding the origin of the data is crucial. Who collected it? How was it collected? What is their incentive?
- Methodology Disclosure: Reputable sources provide detailed methodology sections explaining sample sizes, data collection methods, and margin of error.
- Conflict of Interest: Identify funding sources. Industry-funded reports may present data that favors the sponsor’s interests.
- Track Record: Evaluate the publisher’s history. Have they corrected errors in the past? Do they adhere to editorial standards?
🧠 Managing Bias and Assumptions
Even with verified data, human interpretation introduces bias. Researchers must actively manage their own cognitive biases during the analysis phase.
1. Confirmation Bias
Confirmation bias occurs when researchers favor information that confirms their pre-existing beliefs. In PEST analysis, this might manifest as highlighting economic growth while ignoring inflationary pressures.
- Mitigation: Actively seek data that contradicts your initial hypothesis. Assign a “devil’s advocate” role within the research team to challenge findings.
- Mitigation: Document assumptions made during data selection. Review these assumptions before finalizing the report.
2. Recency Bias
Recency bias leads to over-weighting recent events. A major political scandal or a sudden tech breakthrough might overshadow long-term trends.
- Mitigation: Establish a look-back period. Ensure the analysis includes data from at least five years prior to the current period.
- Mitigation: Weight data points based on trend stability rather than recency alone. A trend established over a decade is more significant than a spike from last month.
3. Availability Heuristic
This heuristic causes researchers to rely on immediate examples that come to mind. Easily accessible data (like news headlines) is often used over harder-to-find, more accurate data (like government archives).
- Mitigation: Create a mandatory source list that requires the inclusion of primary and secondary academic sources.
- Mitigation: Set quotas for data types. For example, require that 40% of economic data come from government or international institutional sources.
✅ Validation Checklist
Before finalizing the PEST analysis, run the data through this validation checklist. This ensures that the research meets academic and strategic standards.
- Source Identification: Is the origin of every data point clearly cited?
- Date Verification: Is the data current and relevant to the analysis period?
- Methodology Review: Has the collection method been evaluated for bias or error?
- Cross-Check: Do independent sources confirm the key findings?
- Contextual Fit: Does the data apply to the specific geographic and industry context?
- Assumption Logging: Have all gaps in data been documented as assumptions rather than facts?
- Peer Review: Has the data interpretation been reviewed by a colleague not involved in the collection process?
🚀 Moving Forward with Rigorous Insights
Implementing verified data into strategic planning transforms the PEST analysis from a theoretical exercise into a practical asset. When the foundation is solid, the strategic decisions built upon it are more resilient to external shocks.
Organizations that invest time in data verification reduce the risk of strategic failure. They build a culture of inquiry where assumptions are challenged and evidence is paramount. This approach requires discipline and resources, but the return on investment is a strategy that withstands scrutiny.
By adhering to these verification protocols, you ensure that your environmental scanning is not just a formality, but a critical component of organizational intelligence. The goal is clarity amidst complexity, using verified facts to navigate an uncertain future.
Remember that data is a tool, not a truth. It must be wielded with care, precision, and an understanding of its limitations. Through rigorous verification, you equip your organization with the insight needed to adapt and thrive.