


Understanding system behavior is a fundamental skill for any computer science student. Among the various modeling techniques available, the Use Case Diagram stands out as a primary tool for capturing functional requirements. This visual representation bridges the gap between abstract business needs and concrete system design. For students entering the field of software engineering, mastering this notation provides clarity in communication and structure in development.
This guide outlines the essential components, relationships, and best practices for creating effective Use Case Diagrams. We will explore how these diagrams function within the broader Software Development Life Cycle (SDLC) and provide practical examples to reinforce learning. By the end of this resource, you will possess a solid foundation for applying these concepts in academic projects and professional settings.
Understanding the Core Purpose of Use Case Diagrams 🎯
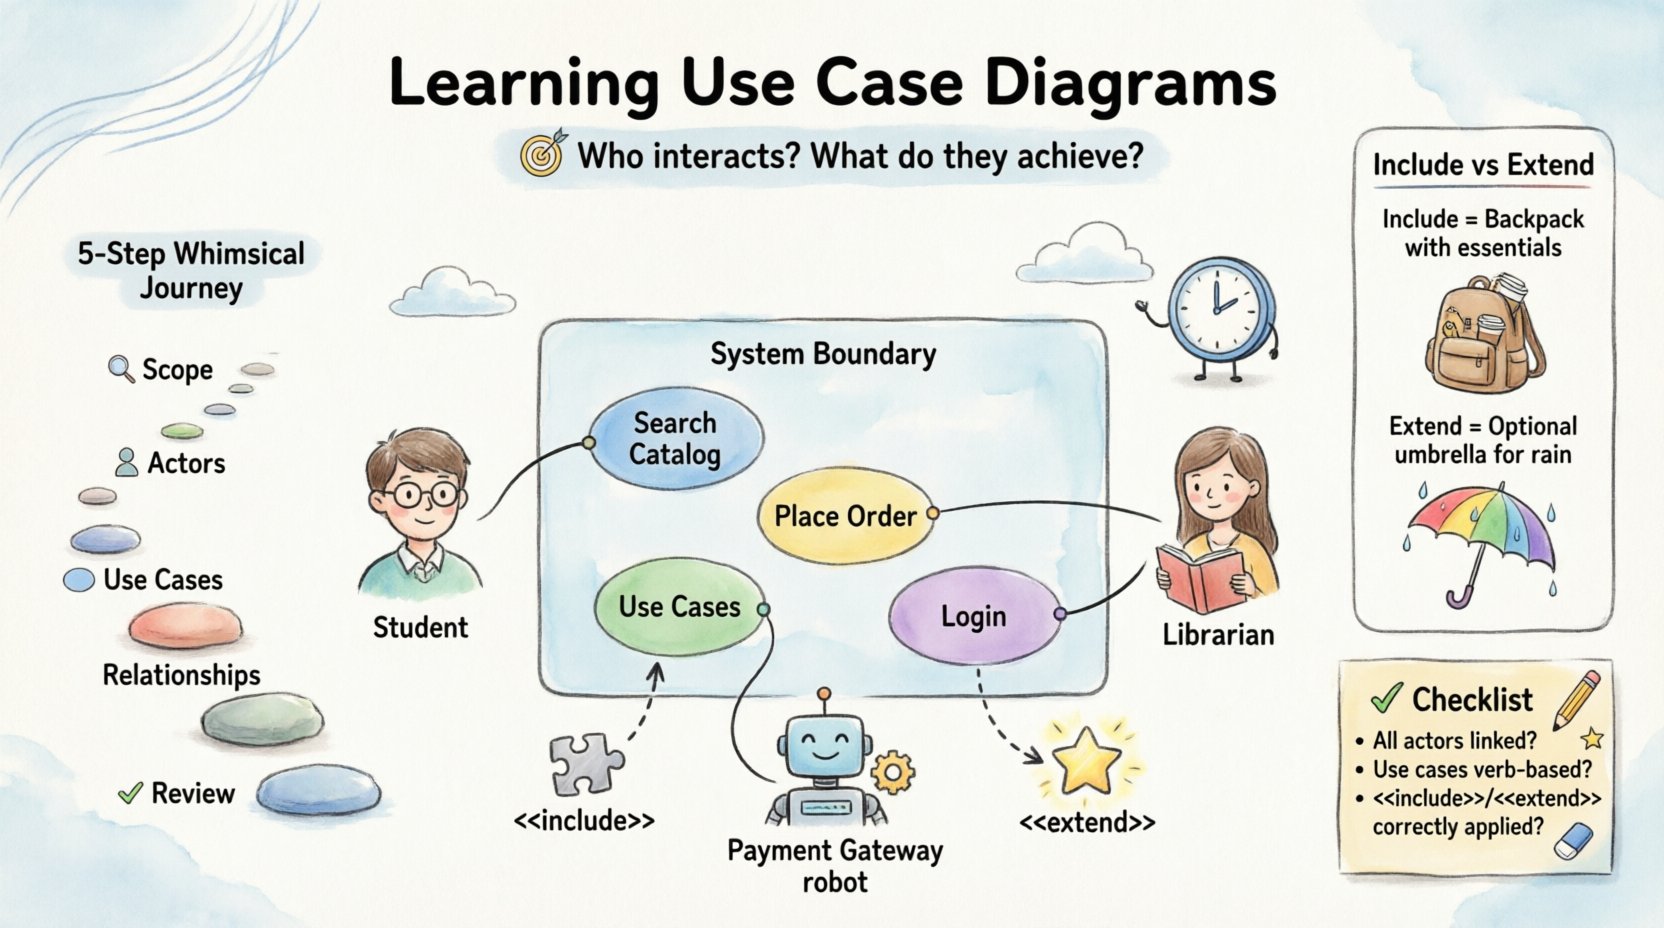
A Use Case Diagram is not merely a drawing; it is a specification of interaction. It answers the question: Who interacts with the system, and what do they achieve?. Unlike class diagrams which focus on static structure, or sequence diagrams which focus on dynamic behavior over time, use case diagrams focus on the external view of functionality.
Key objectives include:
- Requirement Elicitation: Gathering functional needs from stakeholders.
- Communication: Providing a visual language for developers and non-technical users.
- Scope Definition: Clearly marking what is included in the system versus what remains external.
- Testing Foundation: Serving as a baseline for creating test cases to verify system behavior.
Students often mistake these diagrams for flowcharts. It is crucial to distinguish that a Use Case Diagram does not show the internal logic of how a task is completed. It shows that a task can be completed by a specific actor.
Core Components of a Use Case Diagram 🧩
Every diagram consists of specific elements. Understanding the definition and visual representation of each is the first step toward accurate modeling. We will break down the four primary elements: Actors, Use Cases, System Boundaries, and Relationships.
1. Actors 👤
An actor represents a role played by an entity that interacts with the system. It is important to remember that an actor does not have to be a human being. Actors can be:
- Human Users: Administrators, customers, or managers.
- External Systems: Other software applications that provide data or receive data.
- Hardware Devices: Sensors, printers, or payment terminals.
- Time-Based Events: Scheduled processes that trigger actions within the system.
Visual Representation:
- Actors are typically drawn as stick figures.
- Labels are placed near the figure to identify the role.
- Names should be nouns (e.g., Student, Server) rather than verbs.
2. Use Cases 🔄
A use case represents a specific goal or function that an actor wants to accomplish. It is a distinct unit of functionality within the system boundary.
- Granularity: A use case should be atomic. It should not try to do too much. For example, Place Order is better than Manage Shop.
- Verbs: Use cases are usually named using a verb-object structure (e.g., View Report, Update Profile).
- Boundaries: Every use case must reside inside the system boundary to be considered part of the system.
3. System Boundary 🧱
The system boundary is a rectangle that encloses all use cases. It defines the scope of the project. Anything outside this box is considered external to the system.
- Clarity: This helps prevent scope creep by explicitly showing what is being built.
- Interaction: Only actors and relationships crossing this boundary are relevant to the diagram.
4. Relationships 🔗
Relationships define how actors and use cases interact. There are four primary types of relationships used in standard modeling:
- Association: A line connecting an actor to a use case.
- Include: Mandatory behavior inclusion.
- Extend: Optional behavior extension.
- Generalization: Inheritance or specialization.
Deep Dive into Relationships 🔍
Understanding the nuances between relationships is critical for accurate modeling. Misinterpreting these can lead to confusing system logic. The table below provides a structured comparison of the relationship types.
| Relationship Type | Symbol | Meaning | Example Scenario |
|---|---|---|---|
| Association | Solid Line | Direct communication or interaction between actor and use case. | A Customer performs Search Product. |
| Include | Dashed Arrow with <<include>> | The base use case must execute the included use case. It represents reusable functionality. | Login always includes Validate Credentials. |
| Extend | Dashed Arrow with <<extend>> | The extended use case adds functionality to the base use case under specific conditions. It is optional. | Search Product may be extended by Display Recommendations if user is logged in. |
| Generalization | Solid Line with Hollow Triangle | A specialized actor or use case inherits the characteristics of a more general one. | Admin is a type of User. Pay Online is a type of Pay. |
Explaining Include vs. Extend
These two concepts often cause confusion. The difference lies in control flow and necessity.
Include (The Must): When Use Case A includes Use Case B, it means A cannot be completed without B. B is a sub-step of A. This is used to avoid repetition. If five different use cases all require logging in, you create a single Log In use case and include it in all of them.
Extend (The Maybe): When Use Case B extends Use Case A, it means B happens only if a specific condition is met. B is not required for A to complete. This is used for alternative flows. For instance, the system might extend the Checkout process with Apply Coupon only if the user enters a code.
Constructing a Diagram Step-by-Step 🛠️
Creating a diagram without a plan often leads to clutter. Follow this structured approach to ensure consistency and clarity.
Step 1: Identify the System Scope
Before drawing anything, define the boundaries. What is the primary purpose of the software? Is it a library management system? A banking portal? Write down a one-sentence definition of the system. This helps you decide what belongs inside the box.
Step 2: Identify the Actors
List every role that interacts with the system. Ask questions like:
- Who initiates the process?
- Who receives the output?
- Are there any automated systems involved?
Draw the stick figures and label them. Avoid grouping distinct roles under vague names like User unless they share identical permissions.
Step 3: Identify the Use Cases
For each actor, determine what they want to do. Use the verb-object format. Keep the list focused on high-level goals rather than specific screen clicks.
- Bad: Click Submit Button
- Good: Submit Application
Step 4: Draw the Relationships
Connect actors to their relevant use cases. Use solid lines for basic interactions. Then, analyze if any use cases share common sub-processes (Include) or have conditional variations (Extend).
Step 5: Review and Refine
Check for orphan actors (actors with no connections) or orphan use cases (use cases with no actors). A diagram must be functional and interconnected.
Common Mistakes to Avoid ⚠️
Even experienced practitioners make errors when first learning these diagrams. Being aware of these pitfalls helps you produce cleaner models.
1. Mixing Levels of Abstraction
Do not mix high-level goals with low-level implementation details. A diagram should show what the system does, not how it does it. Avoid showing internal database queries or specific UI button clicks.
2. Overusing Include and Extend
While useful, overusing these relationships makes the diagram hard to read. If a sub-process is extremely simple, consider embedding the description in the text rather than drawing a separate box.
3. Vague Actor Names
Using names like User or System is often too broad. Distinguish between roles. For a banking app, differentiate between Account Holder, Bank Manager, and ATM Network.
4. Ignoring the System Boundary
Placing use cases outside the boundary implies they are external to the system, which is confusing. Ensure all functional requirements are enclosed.
Real-World Application Examples 🏢
To solidify understanding, let us look at how these diagrams apply to different scenarios. We will describe the components without relying on specific software tools.
Example 1: Library Management System
Actors: Member, Librarian, System.
- Member: Borrow Book, Return Book, Renew Book, Search Catalog.
- Librarian: Add Book, Remove Book, Manage Members, Generate Reports.
- System: Send Overdue Notice (Time-based actor).
Relationship: The Generate Reports use case might include Calculate Fines as a mandatory step.
Example 2: E-Commerce Platform
Actors: Customer, Payment Gateway, Inventory System.
- Customer: View Products, Add to Cart, Checkout, Rate Product.
- Payment Gateway: Process Payment.
- Inventory System: Update Stock.
Relationship: Checkout extends to Apply Loyalty Points if the customer is a VIP. Checkout includes Validate Card.
Integration into the Software Development Life Cycle (SDLC) 🔄
Use Case Diagrams are not created in isolation. They fit into specific phases of development.
- Requirements Gathering: The diagram is drafted during meetings with stakeholders to confirm understanding.
- Analysis: Developers review the diagram to identify potential data entities and logic flows.
- Design: The diagram informs the architecture. If a use case is complex, it may require a detailed sequence diagram.
- Testing: Testers use the diagram to derive test cases. If a use case is Reset Password, the test suite must cover valid and invalid scenarios.
- Maintenance: As features are added, the diagram is updated to reflect the new scope.
Transitioning from Diagram to Implementation 💻
How do you move from this visual model to actual code? The diagram serves as a contract.
- Function Mapping: Each use case maps to a method or a service in the codebase.
- Interface Definition: Actors often define the API endpoints. A human actor represents a Front-End UI, while a system actor represents an API endpoint.
- Validation Logic: The Include relationships often translate to helper functions or middleware.
- Conditional Logic: The Extend relationships translate to conditional statements (if-else) within the main workflow.
Self-Assessment Checklist ✅
Before finalizing your diagram, run through this checklist to ensure quality.
- Are all actors clearly labeled with nouns?
- Are all use cases labeled with verb-object phrases?
- Is the system boundary clearly drawn and enclosing all use cases?
- Are there any actors or use cases that are not connected to anything?
- Is the distinction between Include and Extend clear?
- Does the diagram represent the functional requirements accurately?
- Is the level of detail appropriate for the project scope?
Final Thoughts on System Modeling 🌟
Creating Use Case Diagrams is an exercise in clarity. It forces you to think about the system from the perspective of the user and the environment. For computer science students, this skill is vital for organizing thoughts before writing a single line of code. It prevents the common issue of building features that do not solve actual problems.
By following structured paths, avoiding common pitfalls, and understanding the relationships between components, you can produce diagrams that serve as effective blueprints. Remember that these diagrams are living documents. They should evolve as the understanding of the system deepens. Consistent practice with these principles will lead to more robust software designs and clearer communication with your team.
Focus on the what and the who. The how comes later in the implementation phase. Keep your diagrams clean, your actors specific, and your boundaries firm. This discipline will serve you well throughout your technical career.