


Introduction: Why I Turned to BPMN (And Why Visual Paradigm Won Me Over)
As a business analyst who’s wrestled with countless workflow documentation tools, I’ll be honest: I was skeptical about adding another diagramming platform to my toolkit. But after a colleague recommended Visual Paradigm for BPMN modeling, I decided to give it a shot—and I’m glad I did. What followed was a surprisingly smooth learning curve that transformed how our team visualizes, communicates, and optimizes business processes.

In this guide, I’m sharing my real-world experience walking through Visual Paradigm’s BPMN features—not as official documentation, but as a fellow practitioner who’s been in the trenches. Whether you’re new to BPMN or looking to level up your modeling game, I hope my hands-on insights save you time and spark some “aha!” moments. Let’s dive in!
Getting Started: Creating Your First BPMN Business Process Diagram
When I first opened Visual Paradigm, I appreciated how intuitive the diagram creation flow was. Here’s exactly how I set up my initial Business Process Diagram (BPD):
-
I navigated to Diagram > New from the application toolbar—simple and discoverable.
-
In the New Diagram window, I selected Business Process Diagram from the template gallery.
-
Clicked Next, then gave my diagram a clear name and brief description (pro tip: be descriptive here—it helps when your model library grows!).
-
I used the Location field to choose which project model would store this diagram (great for organizing complex initiatives).
-
Hit OK, and just like that, my canvas was ready.
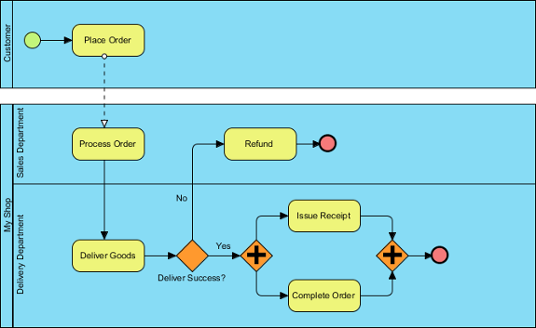 |
|---|
| A sample Business Process Diagram |
My takeaway: The setup process felt frictionless. Within minutes, I was dragging and dropping BPMN elements without hunting through menus. For teams onboarding new members, this simplicity is a huge win.
Making Elements Traceable: My Experience with ID Assignment
One feature that initially seemed like a “nice-to-have” but quickly became essential for me was assigning IDs to model elements. When documenting complex workflows for audit or development handoff, having unique, consistent identifiers for tasks, events, and gateways prevents so much confusion.
Defining a Custom ID Format That Works for Your Team
By default, Visual Paradigm auto-numbers elements starting from 1. But I needed IDs that matched our internal naming convention (e.g., “TASK-001”). Here’s how I customized it:
-
I opened Windows > Project Options from the toolbar.
-
Selected Diagramming on the left, then navigated to the Model Generation tab.
-
Clicked Add, chose the element type (e.g., Task), and configured:
-
Prefix: Added “TASK-“
-
Num of digits: Set to 3 (so “1” becomes “001”)
-
Suffix: Left blank, but useful for department codes
-
GUID: Skipped this—those long random strings aren’t human-friendly for documentation
-
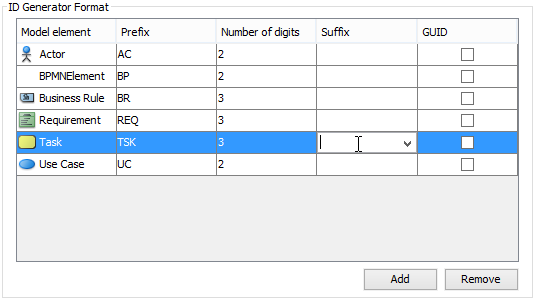 |
|---|
| Defining format of ID |
| Option | Description |
|---|---|
| Prefix | Text to be added before the number |
| Num of digits | The number of digits of the number. For example, when digit is 3, ID “1” will become “001” |
| Suffix | Text to be appended to the number |
| GUID | A randomly generated string. Note that the string will be very long. And by selecting this option, the prefix, num of degits and suffix options will be ignored. |
| Options for formatting ID |
My pro tip: Agree on an ID convention with your team before modeling begins. Consistency across diagrams makes cross-referencing and automation much easier later.
Controlling ID Visibility: What Works Best for Clarity
I learned quickly that showing IDs everywhere can clutter a diagram. Visual Paradigm lets you control this elegantly:
For new diagrams:
I went to Window > Project Options > Diagramming > Business Process > Behavior. In the ID Generator Format section, I chose:
-
Don’t show ID for high-level executive views
-
Show as label (attached to shape) for developer-facing specs
-
Show below caption for documentation exports
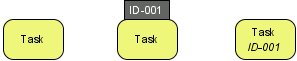 |
|---|
| Different looks of a BPMN task when ID is not shown, ID is shown as label and ID is shown below caption |
For existing diagrams:
Right-click the diagram background > Presentation Options > Configure Show ID Options…. I love that I can adjust ID placement per diagram—super helpful when repurposing a model for different audiences.
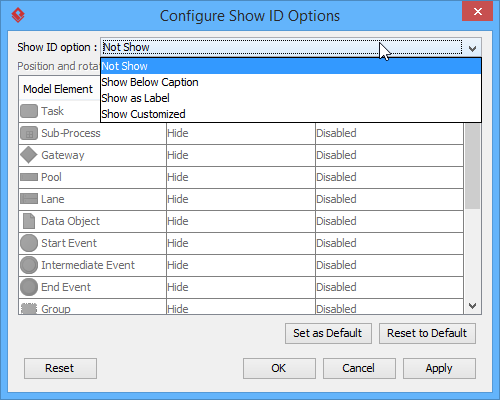 |
|---|
| To configure the whether or not to show ID |
And if you choose “Show as label,” you can fine-tune position and rotation:
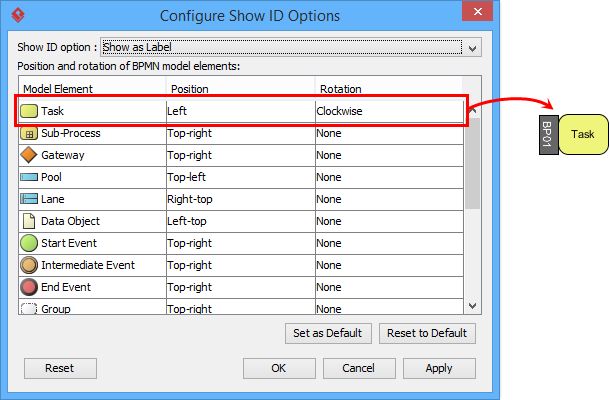 |
|---|
| To make ID of task show as label, position at the left of shape |
My workflow hack: I keep IDs hidden during brainstorming sessions, then enable them as labels when exporting for technical teams. Saves visual noise early, adds traceability later.
Assigning IDs: Three Ways I Use Daily
I’ve found three reliable methods to assign or edit IDs:
-
Specification dialog: Right-click element > Open Specification… (great for bulk edits)
-
Direct label editing: When IDs show as labels, just click and type (fast for quick tweaks)
-
Property Pane: Ideal when I’m already adjusting other element properties
Real talk: The direct label editing is my go-to for rapid iterations. Feels like editing text in a doc—no modal dialogs slowing me down.
Nested IDs: Keeping Hierarchies Clear
When modeling processes with pools, lanes, or sub-processes, I enable Nested IDs to reflect parent-child relationships (e.g., Pool “3” contains tasks “3.1”, “3.2”). To toggle this:
-
Right-click the BPD > Diagram Content > Edit IDs…
-
Check/uncheck Sub-Level ID at the bottom
Why I love this: During a recent audit, nested IDs let stakeholders instantly trace a sub-task back to its parent process. No more “Which pool does this belong to?” questions.
Adding Value: Showing Process Statistics for Data-Driven Decisions
One feature that surprised me with its practicality was Process Statistic. As someone who needs to justify process improvements with data, having instant metrics on my diagram is invaluable.
To access it:
-
Right-click the diagram background
-
Select Utilities > Show Statistic…
 |
|---|
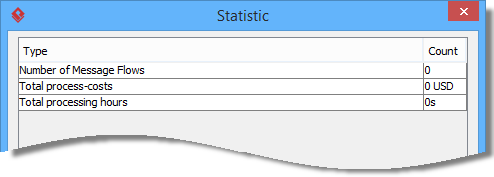
| Process statistic |
| Figure | Description |
|---|---|
| Number of Message Flows | The number of message flows that exist in the current diagram. |
| Total process-costs | A summation of costs specified for tasks and sub-processes in the current diagram. |
| Total processing hours | A summation of duration specified for tasks and sub-processes in the current diagram. |
My use case: Before a leadership review, I populated task durations and costs. The statistic panel instantly showed total processing hours and budget impact—turning my diagram from a visual aid into a decision-support tool. Game-changer.
Conclusion: Why This Approach Transformed My Workflow Modeling
After months of using Visual Paradigm for BPMN, I can confidently say it’s earned a permanent spot in my toolkit. What started as a trial became a cornerstone of how my team designs, documents, and optimizes processes. The balance of powerful features (like customizable IDs and process statistics) with intuitive usability is rare—and deeply appreciated by both technical and non-technical stakeholders.
If you’re considering diving into BPMN modeling: start small. Create one diagram, experiment with ID formatting, and try the statistic feature on a pilot process. You’ll likely find, as I did, that the clarity and traceability these tools provide pay dividends in reduced rework, clearer communication, and more confident decision-making.
Most importantly, remember that BPMN isn’t just about drawing pretty diagrams—it’s about creating a shared language for how work gets done. Tools like Visual Paradigm, used thoughtfully, help turn that language into action.
Happy modeling! 🎯
References
- Business Process Model and Notation (BPMN) Official Site: The official resource for BPMN standards, specifications, and foundational documentation.
- Visual Paradigm BPMN Diagram and Tools: Overview of Visual Paradigm’s BPMN modeling capabilities, features, and diagramming tools.
- BPMN Tutorials Category: A curated collection of step-by-step tutorials for mastering BPMN modeling techniques in Visual Paradigm.
- What is BPMN? An Introductory Guide: A beginner-friendly guide explaining BPMN fundamentals, notation elements, and modeling best practices.
- Visual Paradigm YouTube Channel: Video tutorials, feature demonstrations, and tips for getting the most out of Visual Paradigm tools.
- Visual Paradigm Support Portal: Access to technical support, documentation, community forums, and feature requests for Visual Paradigm users.