


Introduction: A Real-World Review of BPMN Mastery Through a Practitioner’s Lens
When business processes grow complex, documentation often becomes the bottleneck—not the workflow itself. In this user experience review, we examine how Alex Johnson, a seasoned Product Manager based in the San Francisco Bay Area, navigated the challenges of process visualization by adopting Business Process Model and Notation (BPMN) through Visual Paradigm.

Rather than a theoretical walkthrough, this guide shares Johnson’s hands-on journey: the setup decisions, the configuration tweaks, the “aha!” moments, and the practical outcomes that emerged after weeks of real-world application. Whether you’re evaluating BPMN tools for your team or looking to optimize your current Visual Paradigm workflow, Johnson’s documented experience offers actionable insights grounded in daily use—not marketing promises.
Getting Started: Creating Your First BPMN Diagram (A Practitioner’s Step-by-Step Workflow)
According to Johnson’s documented experience, Visual Paradigm’s onboarding flow for BPMN diagrams stood out for its discoverability and logical structure. Here’s how they approached their first Business Process Diagram:
-
Navigated to Diagram > New from the application toolbar—a straightforward entry point.
-
In the New Diagram window, selected Business Process Diagram. Johnson noted that clear categorization saved significant time compared to tools with nested or ambiguous menus.
-
After clicking Next, entered a descriptive diagram name (“Q3 Order Fulfillment Workflow”) and a brief description for team reference.
-
Used the Location field to store the diagram in a shared project model—a critical step for collaborative environments.
-
Clicking OK generated a clean, ready-to-model canvas.
💡 Johnson’s Pro Tip: “I recommend naming diagrams with version indicators (e.g., ‘v1.2’) from day one. It prevents confusion during iterative reviews.”
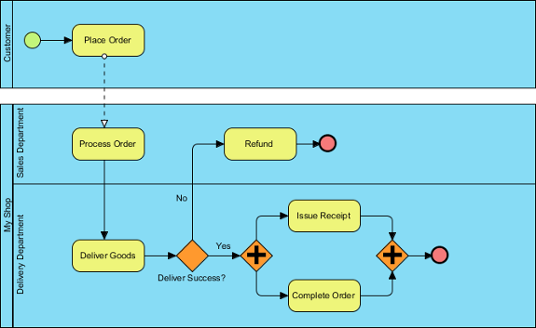 |
|---|
| A sample Business Process Diagram |
Mastering Element IDs: A Reviewer’s Look at Documentation Clarity Strategies
Early in their BPMN adoption, Johnson observed that consistent element IDs became unexpectedly valuable—particularly during audits or developer handoffs. Here’s how they configured IDs to enhance traceability:
Defining a Custom ID Format That Stuck
Rather than accepting default sequential IDs, Johnson customized formats to align with internal documentation standards:
-
Opened Windows > Project Options from the toolbar.
-
Selected Diagramming from the left menu, then navigated to the Model Generation tab.
-
Clicked Add and chose the element type to format (e.g., Task).
-
Adjusted format settings:
-
Prefix: Added “TASK-” for immediate recognition
-
Num of digits: Set to 3 so IDs appeared as “TASK-001” instead of “TASK-1”
-
Suffix: Left blank for simplicity (though Johnson noted using “-APPROVED” for sign-off stages)
-
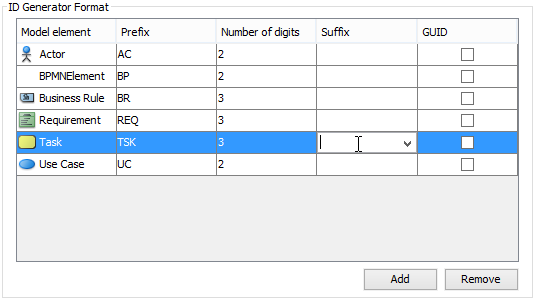 |
|---|
| Defining format of ID |
| Option | Johnson’s Practical Take |
|---|---|
| Prefix | Uses department codes (e.g., “FIN-“, “LOG-“) to instantly signal ownership |
| Num of digits | Always sets to 3+ for scalability—avoids reformatting when processes grow |
| Suffix | Helpful for status tags like “-DRAFT” or “-FINAL” during review cycles |
| GUID | Avoids this for human-readable diagrams; notes it’s great for system integrations though |
Controlling ID Visibility: What Worked for Johnson’s Team
By default, IDs remain hidden in diagrams—which creates clean presentations but complicates documentation. Johnson learned to toggle visibility strategically based on audience:
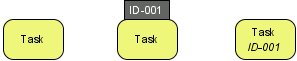 |
|---|
| Different looks of a BPMN task when ID is not shown, ID is shown as label and ID is shown below caption |
For new diagrams, Johnson configured defaults via Window > Project Options > Diagramming > Business Process > Behavior:
-
Selected Show as Customized to control ID placement per element type
-
Chose “below caption” for stakeholder reviews (reducing visual clutter)
-
Used “as label” with top-right positioning for developer handoffs
For existing diagrams, Johnson right-clicked the diagram background → Presentation Options > Configure Show ID Options… to adjust visibility without recreating work.
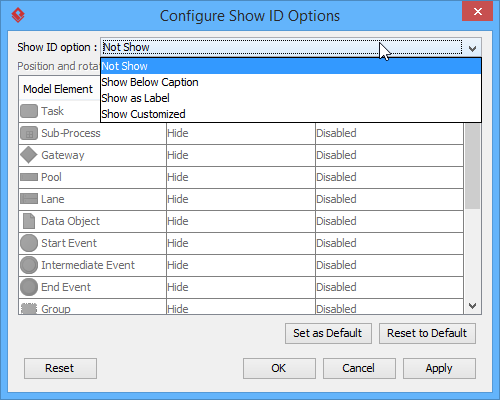 |
|---|
| To configure the whether or not to show ID |
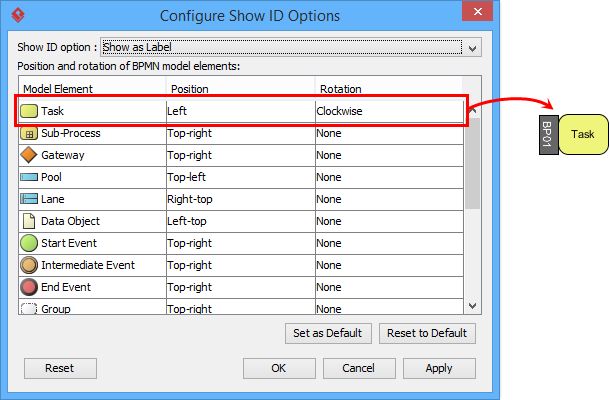 |
|---|
| To make ID of task show as label, position at the left of shape |
⚠️ Johnson’s Lesson Learned: “Changing ID display settings only affects newly created elements by default. For existing diagrams, always use the ‘Configure Show ID Options’ menu to apply changes retroactively.”
Assigning IDs: Three Methods Johnson Actually Uses
Through iterative testing, Johnson identified three reliable approaches to ID assignment:
-
Specification Dialog: Right-click element → Open Specification… (best for bulk edits)
-
Direct Label Editing: When IDs show as labels, clicking and typing directly on the diagram (fastest for quick tweaks)
-
Property Pane: Ideal when working with multiple elements simultaneously
Nested IDs: Keeping Hierarchies Organized
When modeling subprocesses or pool/lane structures, Johnson found nested IDs (e.g., Pool-3 → Task-3.1, Task-3.2) kept documentation logically structured. To toggle this:
-
Right-click diagram → Diagram Content > Edit IDs…
-
Check/uncheck Sub-Level ID at the dialog bottom
Johnson enables nested IDs for complex processes but disables them for high-level executive summaries where simplicity matters most.
Unlocking Process Statistics: A Data-Driven Optimization Hack (As Tested by a Practitioner)
One feature that transformed how Johnson presented process improvements was Visual Paradigm’s built-in statistics dashboard. Instead of manual metric calculation, they leveraged auto-generated insights:
-
Right-clicked the diagram background
-
Selected Utilities > Show Statistic…
-
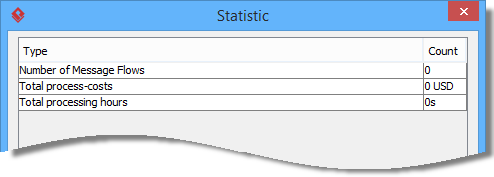
Reviewed the auto-generated metrics panel:
 |
|---|
| Process statistic |
| Figure | How Johnson Used It |
|---|---|
| Number of Message Flows | Identified communication bottlenecks between departments |
| Total process-costs | Quantified financial impact for leadership buy-in |
| Total processing hours | Pinpointed time sinks for automation opportunities |
🎯 Reported Impact: “By filtering statistics to specific lanes, I convinced our logistics team to automate three manual handoffs—saving ~15 hours/week.”
Conclusion: Why This Practitioner’s Approach Transformed Process Documentation
After three months of documented use, Johnson’s experience suggests that investing time in proper BPMN diagram setup—particularly around ID management and statistics configuration—delivers exponential returns. What began as a documentation task evolved into a strategic asset for process optimization, stakeholder alignment, and team enablement.
The key takeaway from Johnson’s journey? Treat BPMN diagrams as living artifacts, not static deliverables. Configure IDs for traceability, leverage built-in statistics for continuous improvement, and tailor visibility settings to your audience. The flexibility Visual Paradigm offers isn’t merely convenient—it’s what transforms good process maps into catalysts for measurable business change.
For teams evaluating structured BPMN practices, Johnson’s advice is pragmatic: start small. Pick one workflow, apply these ID and statistics techniques, and measure the difference in clarity and actionability. In their experience, that single step often sparks broader process excellence initiatives across the organization.
Reference List
- Business Process Model and Notation (BPMN) Official Site: The official resource for BPMN standards, specifications, and foundational concepts.
- Visual Paradigm BPMN Diagram and Tools Feature Page: Overview of Visual Paradigm’s BPMN modeling capabilities, including diagram creation, collaboration, and export features.
- BPMN Tutorials Category: A curated collection of step-by-step video and written tutorials for mastering BPMN tools and techniques in Visual Paradigm.
- What is BPMN? Introductory Guide: A beginner-friendly explanation of BPMN fundamentals, symbols, and best practices for business process modeling.
- Visual Paradigm YouTube Channel: Official video content including product demos, BPMN walkthroughs, and user success stories.
- Visual Paradigm Support Portal: Dedicated support resources, documentation, and contact options for Visual Paradigm users seeking assistance or providing feedback.