


External forces shape business outcomes just as much as internal decisions do. Understanding these forces is not optional for any organization aiming for longevity. A PEST analysis offers a structured method to scan the macro-environmental factors that impact your strategy. This framework helps teams identify opportunities and threats before they become critical issues. With the right approach, you can complete a robust PEST analysis in less than 60 minutes.
This guide walks you through the process of conducting a PEST framework efficiently. We focus on actionable steps, avoiding unnecessary theory. By the end of this session, you will have a clear view of the political, economic, social, and technological factors influencing your market.
Why Conduct a PEST Analysis? 🤔
Strategic planning often focuses heavily on internal capabilities. However, a company can have excellent products and teams and still fail if external conditions shift unexpectedly. A PEST analysis provides a snapshot of the external environment. It is particularly useful during the early stages of market entry or when planning long-term growth.
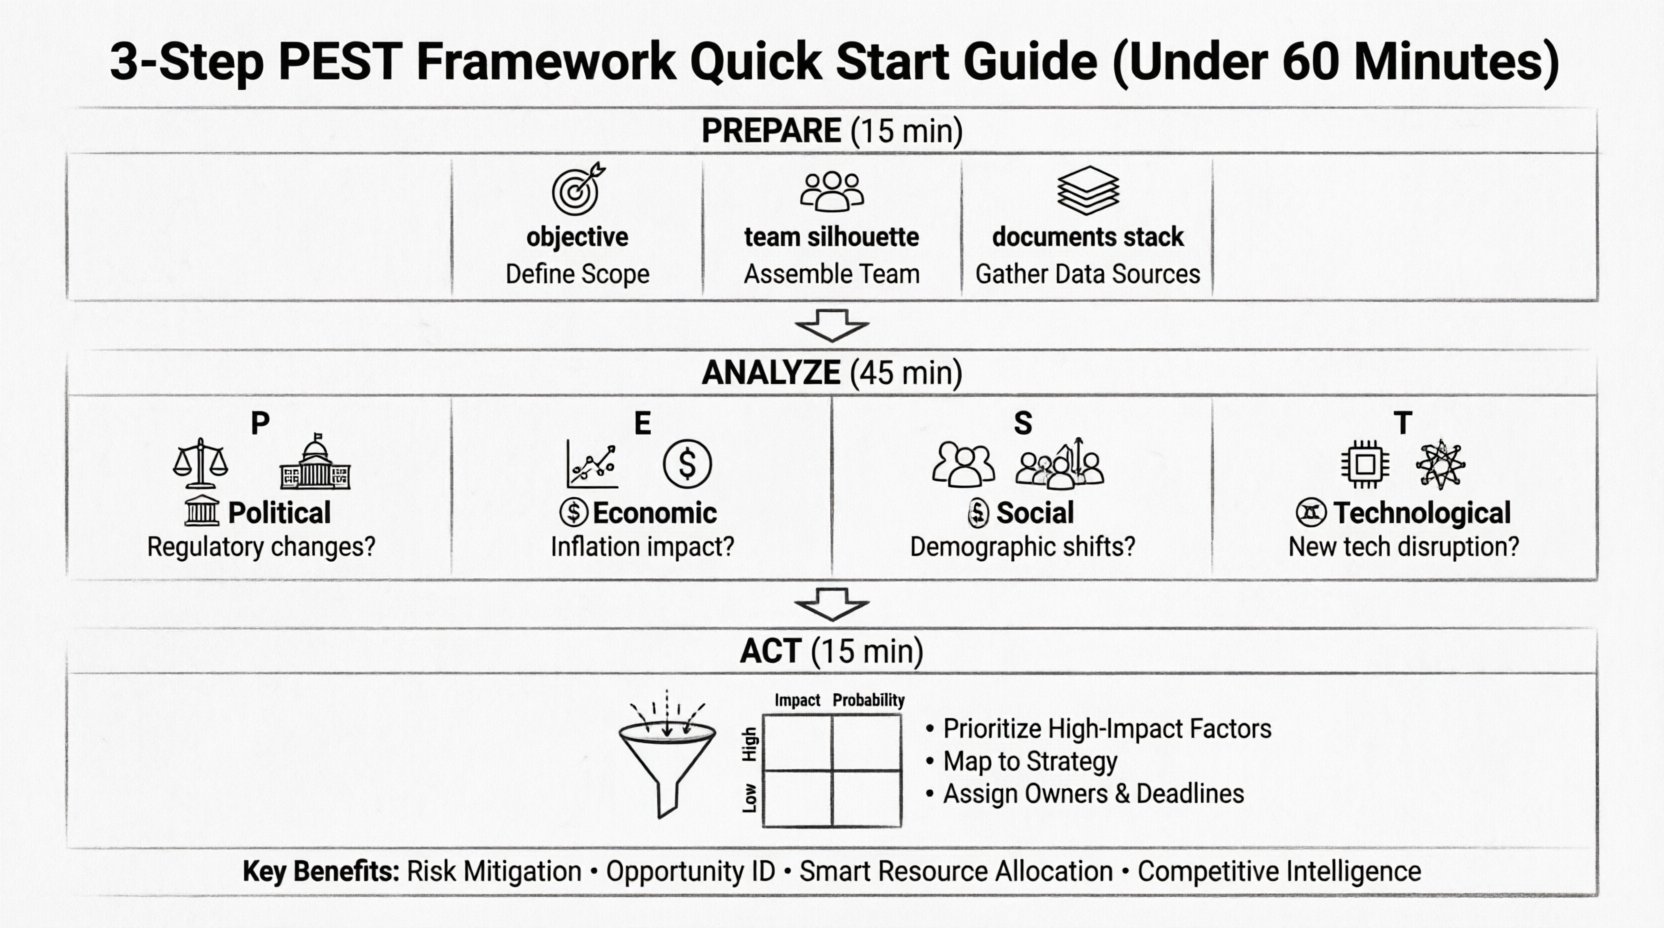
- Risk Mitigation: Identifying regulatory changes early allows for preparation.
- Opportunity Identification: Spotting demographic shifts can reveal new customer segments.
- Resource Allocation: Understanding economic trends helps in budgeting for future stability.
- Competitive Intelligence: Seeing how competitors react to macro factors informs your own moves.
While some frameworks like PESTLE add Legal and Environmental layers, the core PEST model remains the most efficient for rapid assessment. This quick-start version focuses on the essential four pillars to ensure speed without sacrificing depth.
Step 1: Preparation and Scope Definition 🛠️
The quality of your analysis depends entirely on the clarity of your starting point. Before diving into data gathering, you must define the boundaries of the exercise. A vague scope leads to vague insights.
Define the Objective 🎯
Ask yourself what the analysis is trying to achieve. Is it for a new product launch? For a budget review? For a merger or acquisition? The objective dictates the timeframe and the specific regions you will analyze.
- Timeframe: Are you looking at the next 12 months or the next 5 years? A 12-month view focuses on immediate trends, while a 5-year view requires looking at long-term structural shifts.
- Geography: Is the focus local, regional, or global? A political factor in one country might be irrelevant in another.
- Industry: A technology company faces different technological factors than a manufacturing firm.
Assemble the Right Team 👥
You do not need a large group, but you do need diverse perspectives. A single individual often has blind spots. Include representatives from:
- Strategy: To align findings with long-term goals.
- Operations: To understand logistical constraints.
- Marketing: To interpret social and economic trends from a consumer view.
- Finance: To assess economic impact and risk.
Gather Data Sources 📚
Do not rely on intuition. Use credible sources to validate your observations. You need a mix of primary and secondary data.
- Government Reports: Census data, economic surveys, and legislative updates.
- Industry Publications: Trade journals and market research reports.
- News Media: Current events that might signal upcoming shifts.
- Internal Data: Historical sales data that might correlate with external factors.
Step 2: The Core Analysis (P, E, S, T) 🧠
This is the heart of the framework. You have 45 minutes to complete this step. Divide your time equally among the four categories. Focus on factors that are currently relevant and have high impact.
1. Political Factors (P) 🏛️
Political factors refer to how government intervention affects the economy. This includes tax policy, labor law, environmental law, trade restrictions, and political stability.
- Regulatory Environment: Are there new laws coming into effect that could increase compliance costs?
- Tax Policies: How might changes in corporate tax rates affect your bottom line?
- Trade Agreements: Are tariffs being imposed on your raw materials or export markets?
- Stability: Is the political climate stable enough to support long-term investment?
2. Economic Factors (E) 💰
Economic factors determine the purchasing power of potential customers and the firm’s cost of capital. This includes exchange rates, inflation, interest rates, and economic growth.
- Inflation Rates: High inflation increases input costs and may reduce consumer spending power.
- Interest Rates: Higher rates make borrowing more expensive, impacting expansion plans.
- Exchange Rates: If you import materials, currency fluctuations can alter margins.
- GDP Growth: Is the economy expanding or contracting? This dictates market demand.
3. Social Factors (S) 👥
Social factors analyze the cultural and demographic aspects of the environment. This includes population growth, age distribution, career attitudes, and health consciousness.
- Demographics: Is the population aging? Is there a shift in urbanization?
- Consumer Behavior: Are people shifting towards sustainable products or remote work?
- Health & Wellness: Are there trends in lifestyle that affect product demand?
- Ethics & Culture: How do social values impact brand perception?
4. Technological Factors (T) 💻
Technological factors encompass the rate of technological innovation, automation, and research and development activity. It is often the fastest-moving category.
- Innovation: Are there new technologies that could disrupt your business model?
- Infrastructure: Is digital infrastructure improving in your target markets?
- Automation: Can automation reduce costs or improve efficiency?
- Disruption: Are competitors adopting new tech that you are ignoring?
Quick Reference Table 📋
Use this table to organize your brainstorming session quickly.
| Category | Key Question | Example Impact |
|---|---|---|
| Political | How does government policy affect us? | New data privacy laws increase compliance costs. |
| Economic | What is the state of the economy? | Recession reduces discretionary spending. |
| Social | What are the lifestyle trends? | Shift to remote work increases demand for home office gear. |
| Technological | What new tech is emerging? | AI tools automate customer service tasks. |
Step 3: Synthesis and Action Planning 🚀
Data alone is not strategy. The final step is to translate your findings into actionable plans. This step usually takes 15 minutes. You must move from observation to decision.
Identify Critical Factors 🔍
You likely generated many points during Step 2. Not all of them are equally important. Filter them based on two criteria:
- Impact: How significantly will this factor affect the business?
- Probability: How likely is this factor to occur?
Create a matrix. Focus your energy on high-impact, high-probability factors. Low-impact factors can be monitored but do not require immediate action.
Connect to Internal Strategy 🔗
Map the external factors to your internal strengths and weaknesses. This often feeds into a SWOT analysis.
- Threats to Mitigate: If inflation is high, how do you protect margins? (Weakness/Threat)
- Opportunities to Capture: If demographics shift, how do you pivot? (Strength/Opportunity)
- Capabilities Needed: If technology changes, what skills do you need to hire? (Strength/Threat)
Develop an Action Plan ✅
Assign owners to each critical factor. Define what success looks like. Set a timeline.
- Immediate Actions: Things to do within 30 days.
- Strategic Initiatives: Projects that take 6 to 12 months.
- Monitoring: How often will you review these factors? (e.g., quarterly).
Common Pitfalls to Avoid ⚠️
Even with a structured approach, teams often make mistakes that reduce the value of the analysis. Be aware of these common traps.
- Recency Bias: Focusing only on the most recent news. Historical trends matter just as much.
- Confirmation Bias: Only looking for data that supports a decision you have already made. Challenge your own assumptions.
- Over-Generalization: Assuming trends apply to all segments. A trend in one region may not hold in another.
- Static Analysis: Treating the PEST analysis as a one-time event. The external environment is dynamic.
Real-World Application Example 🌍
To illustrate how this works in practice, consider a hypothetical company planning to launch a new electric vehicle charging network.
Political
- Government subsidies for EV infrastructure are increasing.
- Local zoning laws regarding power grid connections are complex.
Economic
- Interest rates are rising, making capital expenditure more expensive.
- Oil prices are volatile, affecting consumer willingness to switch.
Social
- Public concern about carbon emissions is at an all-time high.
- Urbanization is increasing demand for city-center charging.
Technological
- Battery technology is improving, reducing charging time.
- Wireless charging technology is becoming commercially viable.
From this, the company might decide to focus on city centers (Social) while lobbying for zoning reform (Political) and securing fixed-rate financing to mitigate interest rate risk (Economic).
Frequently Asked Questions ❓
How often should a PEST analysis be performed?
There is no fixed rule. For fast-moving industries like technology, a quarterly review is common. For stable industries, an annual review may suffice. The key is to monitor the environment continuously.
What is the difference between PEST and PESTLE?
PESTLE adds Legal and Environmental factors. If your industry is heavily regulated (like healthcare) or focused on sustainability, PESTLE is more appropriate. For a quick start, PEST is sufficient.
Can a small business use this framework?
Absolutely. Small businesses are often more vulnerable to external shocks. A simplified version of this analysis helps small owners anticipate changes before they become crises.
How do I ensure the data is accurate?
Cross-reference multiple sources. Do not rely on a single news outlet or report. Look for consensus among industry analysts and official government statistics.
What happens if the factors change mid-analysis?
This is why you define a scope and timeframe. If a major event occurs (like a policy change), pause and update the specific section. Do not let perfect be the enemy of good.
Final Thoughts on Execution 🏁
Completing a PEST analysis in under an hour is about discipline and focus. It requires a clear scope, a diverse team, and a willingness to make hard decisions based on data. The goal is not to predict the future with certainty, but to be prepared for whatever direction it takes.
By following these three steps, you transform raw data into strategic clarity. This process builds a foundation for resilience. It ensures that your organization is not just reacting to the world, but navigating it with intent.
Start your next planning cycle with this framework. The insights you gain will guide your resource allocation and risk management for the foreseeable future.