


In the complex ecosystem of modern software development, the disconnect between departments often leads to friction. Product managers, developers, designers, and quality assurance specialists frequently operate in silos. They possess different vocabularies, priorities, and mental models of the same system. This fragmentation creates a risk where the final product diverges from the initial vision, or critical requirements are overlooked during the build phase. To mitigate this, teams require a shared language that transcends departmental boundaries. Enter the use case diagram, a visual artifact that serves as a universal translator for system functionality.
When implemented correctly within cross-functional environments, these diagrams do more than map interactions; they foster alignment. They provide a concrete reference point for discussions about scope, behavior, and user goals. This guide explores how to leverage use case diagrams to bridge communication gaps, ensuring that every stakeholder understands the system’s intended behavior without relying on jargon-heavy specifications.
Understanding the Core of the Use Case Diagram 📊
A use case diagram is a behavioral diagram within the Unified Modeling Language (UML) framework. It visualizes the interactions between external entities and the system itself. Unlike technical architecture diagrams that focus on database schemas or server configurations, use case diagrams focus on what the system does from the perspective of the user. This distinction is vital for cross-functional teams because it keeps the conversation centered on value and functionality rather than implementation details.
Key Components Defined
To utilize these diagrams effectively, every team member must understand the fundamental symbols. The following components form the basis of the diagram:
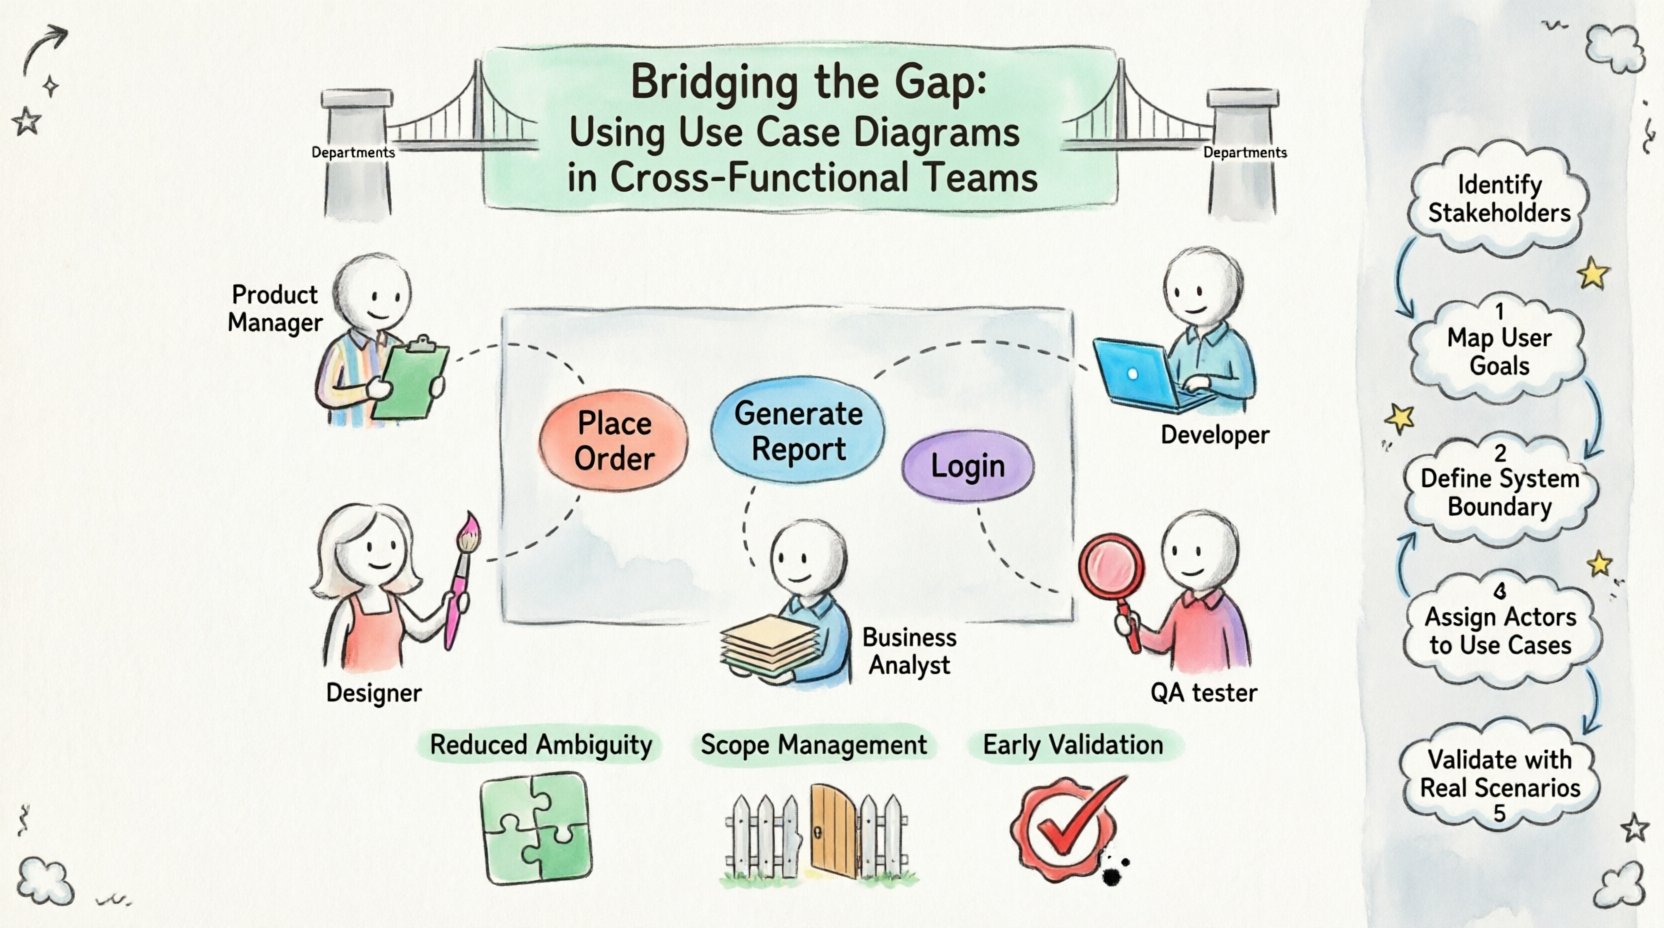
- Actors: Represented by stick figures, actors are the users or external systems that interact with the main system. They can be human roles (e.g., Administrator, Customer) or non-human entities (e.g., Payment Gateway, Third-Party API).
- Use Cases: Represented by ellipses, these describe specific goals or actions the user can achieve within the system. Examples include “Place Order” or “Generate Report”.
- System Boundary: A box that encloses the use cases, defining the scope of the system. Anything outside the box is an external actor.
- Associations: Lines connecting actors to use cases, indicating that a specific actor participates in that specific function.
- Relationships: Lines connecting use cases to other use cases, indicating dependencies such as inclusion or extension.
The Cross-Functional Challenge 🧩
Why is this diagram specifically useful for teams spanning different functions? The answer lies in the nature of the information it conveys. Technical documentation often assumes a baseline of knowledge that non-technical stakeholders do not possess. Conversely, business requirement documents can be too abstract for engineers to implement accurately.
A use case diagram sits in the middle ground. It is visual enough for designers to understand the user flow, yet structured enough for developers to identify the necessary logic gates. It forces the team to agree on the boundaries of the system before writing a single line of code.
Benefits of Shared Visual Artifacts
- Reduced Ambiguity: When a requirement is drawn, it is harder to interpret differently. A line connecting an actor to a use case implies a direct interaction that cannot be easily misread.
- Scope Management: The system boundary clearly delineates what is inside and what is outside. This helps prevent scope creep during development.
- Early Validation: Stakeholders can review the diagram before development begins, catching logical errors in the workflow early.
- Unified Vocabulary: It creates a common reference point. Instead of saying “the part where the user clicks the button,” the team says “the “Submit Form” use case.”
Roles and Responsibilities in Diagramming 👥
In a cross-functional setting, no single person should create the diagram in isolation. Collaboration ensures that different perspectives are captured. Below is a breakdown of how different roles contribute to the creation and validation of the diagram.
| Role | Primary Contribution to Diagram | Key Question They Ask |
|---|---|---|
| Product Owner | Defines the high-level goals and user stories. | “Does this use case deliver value to the customer?” |
| UX Designer | Ensures the flow between use cases makes sense for the user. | “Is the interaction intuitive and accessible?” |
| Developers | Identifies technical constraints and dependencies. | “Is this use case technically feasible within the architecture?” |
| QA Engineers | Identifies edge cases and validation scenarios. | “How do we verify this interaction works correctly?” |
| Business Analysts | Documents the detailed steps within each use case. | “Are all business rules represented here?” |
Step-by-Step Collaboration Process 🛠️
Creating a use case diagram in a cross-functional team requires a structured approach. Ad-hoc drawing often leads to inconsistencies. The following workflow ensures that the diagram evolves through consensus.
1. Define the System Boundary
The first step is to agree on what the system is. This is often the most contentious part of the process. For example, if a team is building a mobile application, does the “Login” process count as part of the app, or is it handled by the operating system? The system boundary must be drawn to include the core functionality and exclude external dependencies unless they are integral to the interaction.
2. Identify the Actors
Brainstorm all potential users and external systems. Group similar actors together to avoid clutter. For instance, instead of having separate actors for “Admin” and “Super Admin,” consider if they share the same interaction patterns. If they do, they can be generalized under a single “Administrator” actor with specific permissions handled elsewhere.
3. Map the Use Cases
For each actor, list the primary goals they want to achieve. These become the use cases. Encourage the team to think in terms of outcomes. Instead of “Click Button X,” the use case should be “Update Profile.” This keeps the focus on the user’s intent.
4. Define Relationships
Once the primary interactions are mapped, look for dependencies. Use the Include relationship for functionality that is mandatory for multiple use cases (e.g., “Login” is included in “Update Profile”). Use the Extend relationship for optional behavior that occurs under specific conditions (e.g., “Show Error Message” extends “Submit Form” only if validation fails).
5. Review and Validate
Hold a session where each team member reviews the diagram from their perspective. The developer looks for technical feasibility, the designer for flow logic, and the product owner for value alignment. Document any changes made during this review.
Common Misconceptions and Pitfalls ⚠️
Even with a collaborative process, teams often stumble on common errors. Being aware of these pitfalls helps maintain the integrity of the diagram.
| Pitfall | Why It Is Problematic | Correct Approach |
|---|---|---|
| Over-technical Detail | Includes database fields or API endpoints inside the diagram. | Keep the diagram focused on user goals, not data structures. |
| Too Many Actors | Clutters the visual and makes it hard to read. | Consolidate actors with similar roles or interactions. |
| Missing System Boundary | Makes it unclear what is inside the system scope. | Always draw a clear box around the use cases. |
| Confusing Include vs. Extend | Misrepresents mandatory vs. optional flows. | Use Include for must-haves, Extend for conditional behaviors. |
| Static Documentation | The diagram is created once and never updated. | Treat the diagram as a living document updated with changes. |
Integrating into Agile Workflows 🔄
Modern development often follows Agile methodologies, where requirements evolve rapidly. A static diagram can become obsolete quickly. To ensure the use case diagram remains relevant, it must be integrated into the sprint cycle.
During sprint planning, the team can refer to the diagram to ensure new user stories align with the established system interactions. If a new feature is requested, it should be mapped onto the diagram first to check for conflicts with existing use cases. This prevents the creation of “islands” of functionality that do not fit the broader system architecture.
Maintaining the Diagram
- Version Control: Store diagram files in the same repository as the code. This ensures that documentation and code are updated simultaneously.
- Change Logs: Maintain a log of who changed what and why. This is crucial for audit trails and understanding the history of the system design.
- Visual Updates: Assign a specific owner, such as a Business Analyst or Lead Architect, to ensure the diagram is updated when the system changes.
Advanced Techniques for Complex Systems 🧠
As systems grow in complexity, a single diagram may not suffice. In these cases, use case modeling can be broken down into multiple views.
1. Use Case Decomposition
If a use case is too complex, it can be broken down into sub-use cases. This is often done by creating a separate diagram for a specific module, such as “Payment Processing.” This keeps the main system diagram clean while providing detail where needed.
2. Actor Grouping
For large systems with many user types, grouping actors can reduce visual noise. You might have a general “User” actor that branches into “Standard User” and “Premium User.” This hierarchy helps clarify permissions without cluttering the main view.
3. System Integration Points
When integrating with external systems, represent them as actors. This highlights the dependencies clearly. For example, if the system relies on an email service, that service becomes an actor connected to the “Send Notification” use case. This helps the team understand which external services must be available for the feature to work.
The Human Element of Diagramming 🧑💻
While the diagram is a technical tool, its primary value is human. It facilitates conversation. A diagram on a whiteboard during a workshop is more powerful than a PDF document in an email. It invites questions and challenges assumptions.
Teams should encourage the use of physical or digital whiteboards during the creation process. This allows for real-time iteration. If a developer suggests that a use case is impossible, the team can adjust the diagram immediately. This immediate feedback loop is the true power of cross-functional collaboration.
Checklist for Diagram Quality ✅
Before finalizing the use case diagram, the team should run a quality check. Use the following checklist to ensure the artifact is robust and useful.
- Clarity: Is the diagram easy to read at a glance?
- Completeness: Do all major user goals have a corresponding use case?
- Consistency: Are the naming conventions consistent across all use cases and actors?
- Accuracy: Does the diagram reflect the actual system behavior or intended behavior?
- Alignment: Do all stakeholders agree on the scope and interactions?
- Scalability: Can the diagram be extended if new features are added later?
Conclusion on Collaboration and Clarity
The journey from a vague requirement to a fully functional system is fraught with potential misunderstandings. Use case diagrams offer a structured method to navigate this journey. By focusing on user goals and system interactions, they strip away the noise of implementation details and focus on the core value proposition.
For cross-functional teams, these diagrams are more than just documentation; they are a tool for consensus. They ensure that the product manager, the developer, and the designer are all looking at the same map. When everyone agrees on the path, the destination is much more likely to be reached successfully. Adopting this practice requires discipline and a commitment to shared understanding, but the reduction in rework and miscommunication makes the effort worthwhile.
By treating the use case diagram as a living, collaborative artifact, teams can build software that is not only technically sound but also aligned with user needs. The gap between teams is not unbridgeable; it simply requires a common language. The use case diagram provides that language, turning a collection of individuals into a cohesive unit working toward a single vision.