


Visual communication is the backbone of effective product management, software architecture, and strategic planning. For years, creating professional diagrams required mastering complex graphical user interfaces or learning disparate syntaxes for different tools. VPasCode, Visual Paradigm’s unified diagram-as-code platform, changes this paradigm by allowing you to create stunning visuals using simple text notation.
Recently, VPasCode expanded its support for Mermaid, one of the most popular text-to-diagram languages, by adding four powerful new diagram types: Ishikawa (Fishbone), Event Modeling, Venn, and Wardley Maps. Whether you are conducting root cause analysis, mapping system behaviors, visualizing set relationships, or strategizing value chains, these new additions empower you to turn ideas into visuals instantly.
This guide will walk you through each of these new diagram types, providing clear examples and syntax explanations to help you get started immediately.
What Makes VPasCode Different?
VPasCode (short for Visual Paradigm’s asCode platform) is a unified text-to-diagram environment. It renders PlantUML, Mermaid, Graphviz, and more, allowing you to freely switch between syntaxes within the same editor without learning multiple tools.
With features like real-time preview, one-click URL sharing, and free SVG/PNG export, VPasCode is designed for efficiency. The following enhancements focus on Mermaid’s latest syntax (v11.12.3+ and v11.15.0+), enabling you to create sophisticated diagrams with minimal effort.
1. Ishikawa (Fishbone) Diagram – Root Cause Analysis
The Ishikawa diagram, also known as a cause-and-effect or fishbone diagram, is a staple in quality management and problem-solving sessions. It helps teams visually brainstorm and categorize the potential causes of a specific problem.
Example – “Blurry Photo” Root Cause Analysis
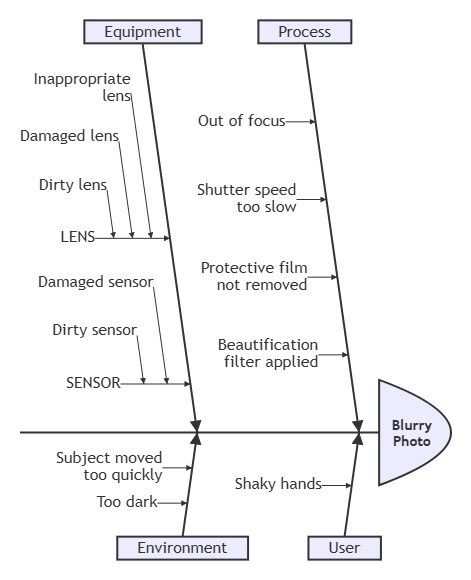
In VPasCode, creating an Ishikawa diagram is intuitive. The first line defines the problem (the fish “head”), and indentation creates the hierarchical cause branches (fishbones).
ishikawa-beta
    Blurry Photo
    Process
        Out of focus
        Shutter speed too slow
        Protective film not removed
        Beautification filter applied
    User
        Shaky hands
    Equipment
        LENS
            Inappropriate lens
            Damaged lens
            Dirty lens
        SENSOR
            Damaged sensor
            Dirty sensor
    Environment
        Subject moved too quickly
        Too dark
2. Event Modeling Diagram – System Behavior over Time
Event Modeling is a powerful technique for describing how information changes within a system over time. It uses UI components, commands, events, and processors organized in swimlanes to visualize system behavior. VPasCode supports both compact and relaxed syntax, inline data, and external data blocks.
Minimal Example – Shopping Cart Add Item Flow
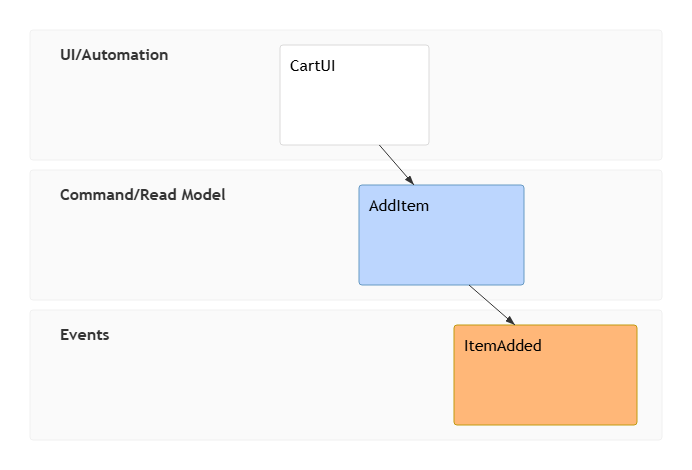
This example shows the basic flow of adding an item to a shopping cart using timeframe (tf) tokens.
eventmodeling

tf 01 ui CartUI
tf 02 cmd AddItem
tf 03 evt ItemAdded
Inline Data Example
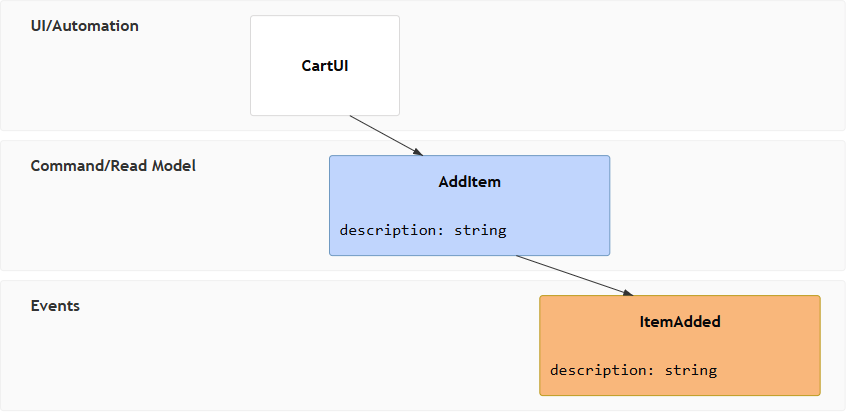
You can include data structures directly within the command or event definitions.
eventmodeling

tf 01 ui CartUI
tf 02 cmd AddItem { description: string }
tf 03 evt ItemAdded { description: string }
Data Blocks & Multiple References
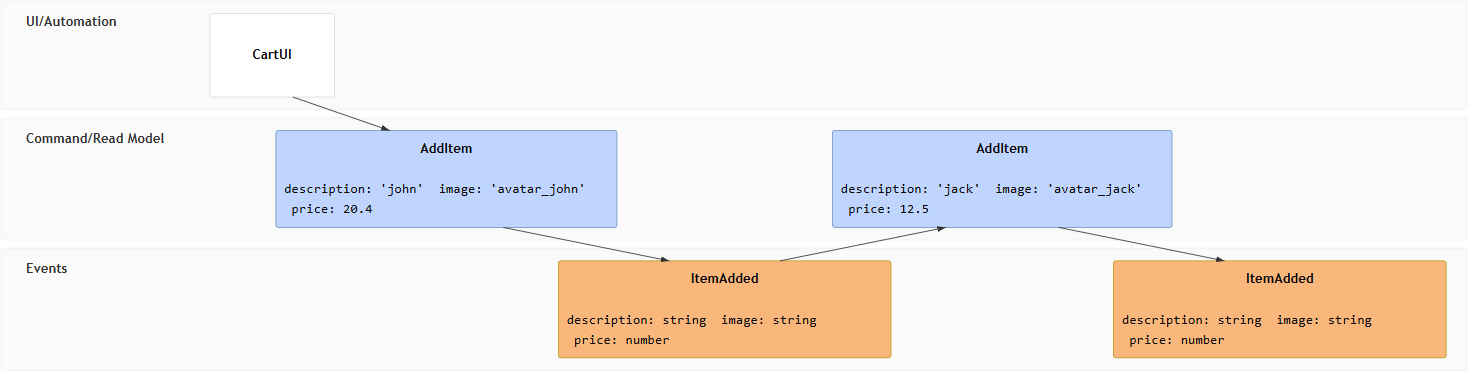
For more complex scenarios, you can define data blocks separately and reference them using double brackets [[ ]].
eventmodeling

tf 01 ui CartUI
tf 02 cmd AddItem [[AddItem01]]
tf 03 evt ItemAdded [[ItemAdded]]
tf 04 cmd AddItem [[AddItem02]]
tf 05 evt ItemAdded [[ItemAdded]]

data AddItem01 {
  description: 'john'
  image: 'avatar_john'
  price: 20.4
}

data AddItem02 {
  description: 'jack'
  image: 'avatar_jack'
  price: 12.5
}

data ItemAdded {
  description: string
  image: string
  price: number
}
Reset Frame
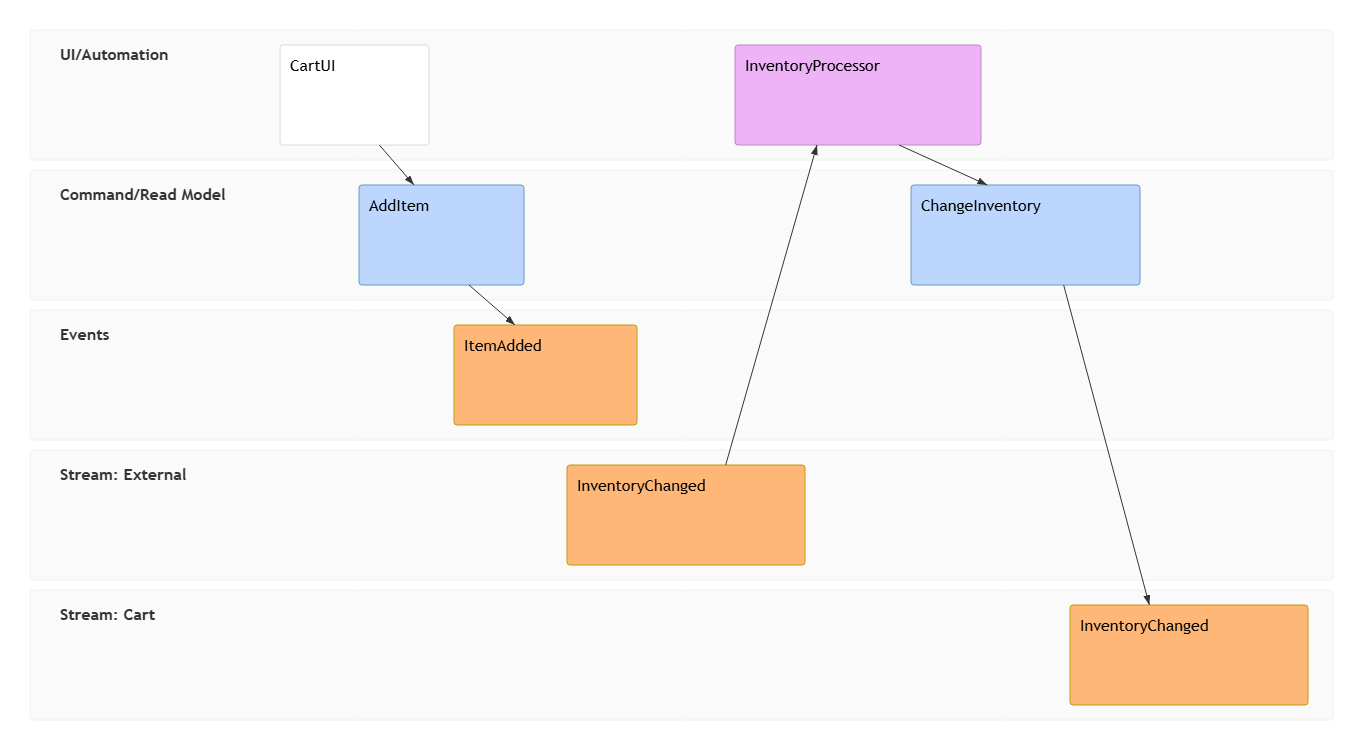
Use rf (resetframe) to indicate external events or state resets, and namespaces to create separate swimlanes.
eventmodeling

tf 01 ui CartUI
tf 02 cmd AddItem
tf 03 evt ItemAdded

rf 04 evt External.InventoryChanged
tf 05 pcr InventoryProcessor
tf 06 cmd ChangeInventory
tf 07 evt Cart.InventoryChanged
Key Tokens:
tf(timeframe),rf(resetframe),ui / cmd / evt / pcr / rmo(entity types). Use namespaces likeInventory.InventoryChangedto create separate swimlanes.
3. Venn Diagram – Set Relationships & Intersections
Venn diagrams are essential for visualizing logical relationships between sets, such as team skills, market overlaps, or feature intersections. VPasCode supports custom sizes, labels, text nodes, and styling.
Basic Example – Team Overlap
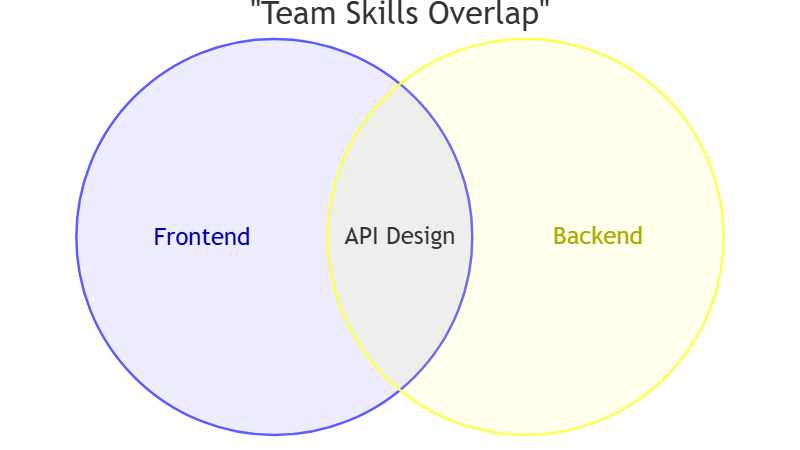
This simple example shows the overlap between Frontend and Backend teams.
venn-beta
  title "Team Skills Overlap"
  set Frontend
  set Backend
  union Frontend,Backend["API Design"]
Sizes, Text Nodes & Styling Example
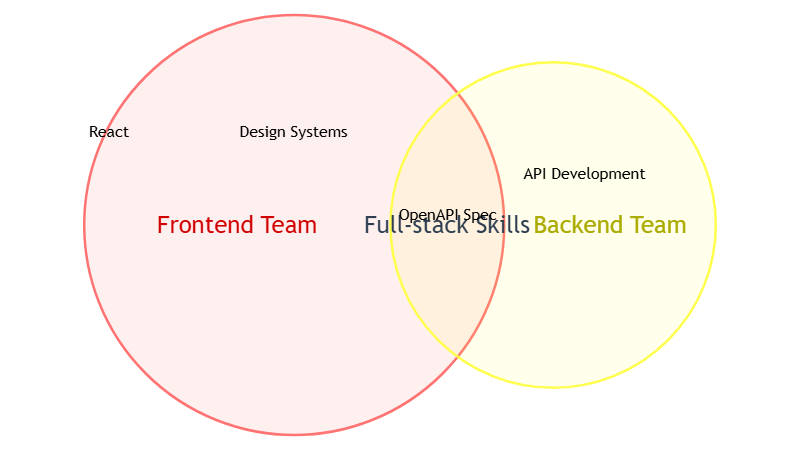
You can control circle size with :number, add internal labels with text, and customize colors with style.
venn-beta
  set A["Frontend Team"]:20
    text A1["React"]
    text A2["Design Systems"]
  set B["Backend Team"]:12
    text B1["API Development"]
  union A,B["Full-stack Skills"]:3
    text AB1["OpenAPI Spec"]
  style A fill:#ff6b6b
  style A,B color:#2c3e50
  style A1 color:#e74c3c
4. Wardley Maps – Strategic Value Chain Mapping
Wardley Maps are strategic tools that help you visualize the components of a business or system, their position in the value chain, and their evolutionary stage (from Genesis to Commodity). VPasCode fully supports the official Mermaid Wardley syntax using wardley-beta.
Example – Software Development Pipeline
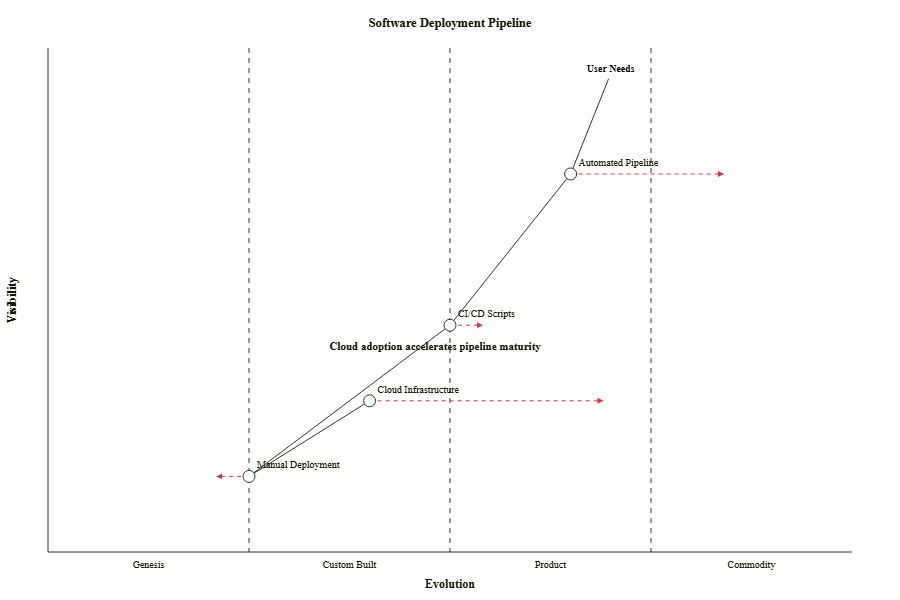
This map illustrates the evolution of a software deployment pipeline, from manual processes to automated cloud infrastructure.
wardley-beta
title Software Deployment Pipeline

anchor "User Needs" [0.95, 0.70]
component "Manual Deployment" [0.15, 0.25]
component "CI/CD Scripts" [0.45, 0.50]
component "Automated Pipeline" [0.75, 0.65]
component "Cloud Infrastructure" [0.30, 0.40]

"User Needs" -> "Automated Pipeline"
"Automated Pipeline" -> "CI/CD Scripts"
"CI/CD Scripts" -> "Manual Deployment"
"Manual Deployment" -> "Cloud Infrastructure"

evolve "Manual Deployment" 0.20
evolve "CI/CD Scripts" 0.55
evolve "Automated Pipeline" 0.85
evolve "Cloud Infrastructure" 0.70

note "Cloud adoption accelerates pipeline maturity" [0.40, 0.35]
Note: Component names with spaces must be wrapped in double quotes. Coordinates range from 0 to 1 on both axes (visibility vs. evolution).
Try VPasCode Right Now
Ready to start creating? Go to the VPasCode editor at https://www.vpascode.com/. Select the Mermaid syntax mode, paste any of the code examples above, and watch your diagram render instantly.
Start for free – No credit card required, no installation. All you need is a browser. Whether you are a product manager, developer, or strategist, VPasCode provides the tools you need to communicate complex ideas with clarity and precision.
Conclusion
The addition of Ishikawa, Event Modeling, Venn, and Wardley maps to VPasCode’s Mermaid support marks a significant step forward in diagram-as-code capabilities. These tools empower users to tackle a wide range of visual communication challenges, from root cause analysis to strategic planning, all within a unified, text-based environment. By leveraging these new diagram types, you can streamline your workflow, enhance collaboration, and create professional-grade visuals with ease. As VPasCode continues to evolve, it remains committed to providing developers, architects, and product managers with the most versatile and user-friendly diagramming platform available.
Reference List
-
Comprehensive Guide to VPasCode by Visual Paradigm: A detailed overview of VPasCode features, including syntax handling and AI integration.
-
Introducing VPasCode: The Ultimate Unified Text-to-Diagram Platform: Official release notes introducing VPasCode and its core capabilities.
-
Clarity by Design: Streamlining Infrastructure Documentation with VPasCode and Graphviz: A guide on using VPasCode for infrastructure documentation with Graphviz support.
-
Mastering VPasCode: The Ultimate Guide to AI-Powered Diagram as Code with Multi-Engine Support: An advanced guide covering AI features and multi-engine support in VPasCode.
-
How the Visual Paradigm AI Chatbot and VPasCode Function as an Integrated Ecosystem for Diagramming: Insights into the integration between VPasCode and Visual Paradigm’s AI chatbot.
-
VPasCode Features Overview: A summary of key features offered by VPasCode.
-
Break Language Barriers Natively with VPasCode’s New AI Diagram Translation: Release notes on AI-driven diagram translation capabilities.
-
Case Study: Accelerating Software Architecture Documentation with VPasCode – A Diagram as Code Revolution: A real-world case study demonstrating the impact of VPasCode on software architecture documentation.